
SSA: GAMA Survey Spectra and Image Cutouts from Multiple Sky Positions
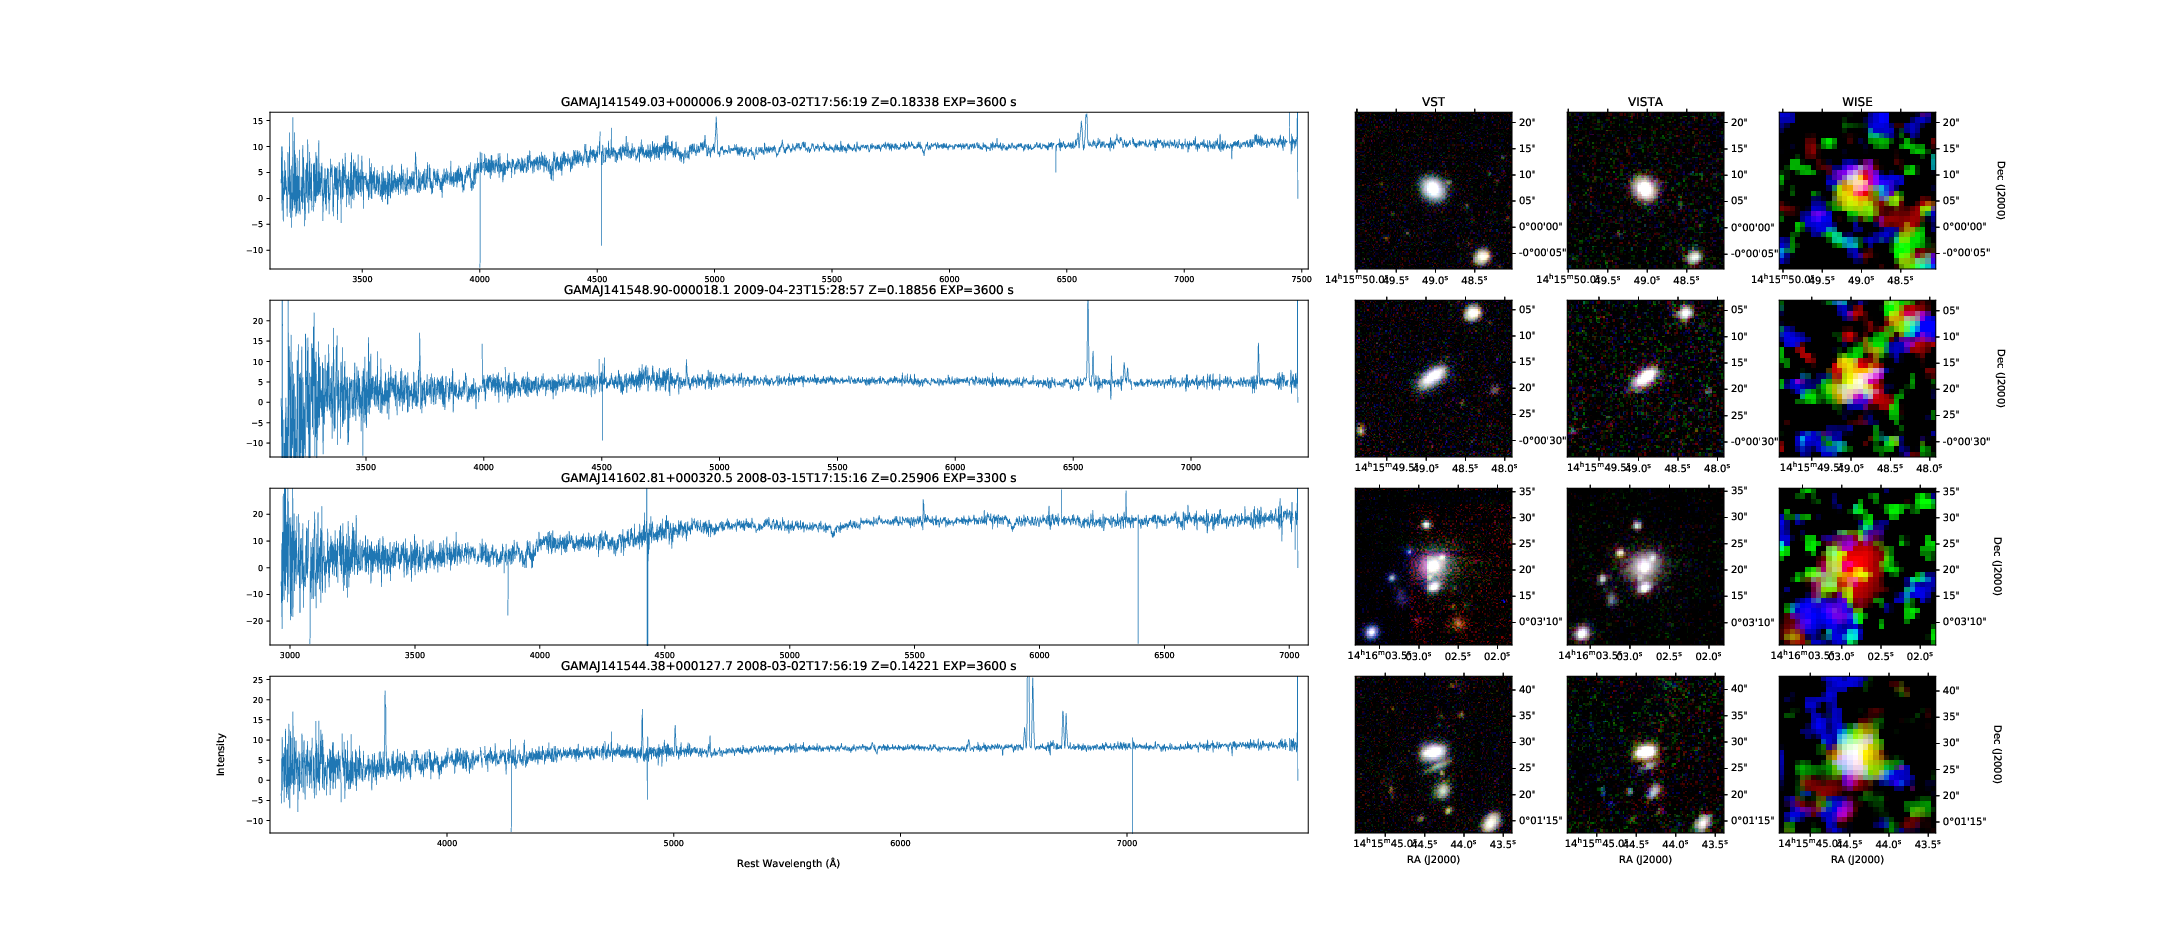
gama_dr2 spectra for four targets and their VST (optical), VISTA (NIR) and WISE (MIR) image cutouts extracted using the DataCentral SIA2 service.
This example is similar to the 6dfgs example, but instead it uses the DataCentral SIA service to generate the image cutouts to accompany gama_dr2 spectra.
Two separate cone search queries are made at RA,Dec=214,0 deg and 217,0 deg, before being combined together.
Note the number of results plotted is artificially limited in this example to 8.
from astropy.coordinates import SkyCoord
from specutils import Spectrum1D
import matplotlib.pyplot as plt
import matplotlib as mpl
from matplotlib.backends.backend_pdf import PdfPages
from matplotlib import gridspec
import numpy as np
import pandas as pd
from astropy.io import fits
from astropy.wcs import WCS
from astropy.stats import sigma_clip
import multicolorfits as mcf
from astropy.time import Time

from astropy.visualization import MinMaxInterval

import requests
from io import BytesIO

from astropy import units as u
import os
#import pyvo as vo
from pyvo.dal.ssa  import search, SSAService
from pyvo.dal.sia2 import SIAService


#Generate an rgb image from an SIA query
#Note that custom must have the FILTER specified as a list with elements in the order r, g, b
def get_rgb_img(pos,custom):
    #URL for the AAO DataCentral SIA2 service
    sia_url = "https://datacentral.org.au/vo/sia2/query"
    sia_service = SIAService(sia_url)
    print ("Generating colour image...")
    sia_results = sia_service.search(pos=pos,**custom)
    sia_df = sia_results.votable.get_first_table().to_table(use_names_over_ids=True).to_pandas()
    print (sia_df)
    if(sia_df.shape[0] == 3):
        #find the rows corresponding to the requested FILTER and extract access_url
        #then send to get_fits_data to download the fits image
        rdata = get_fits_data(sia_df[sia_df['band_name'] == custom['FILTER'][0]]['access_url'].values[0])
        gdata = get_fits_data(sia_df[sia_df['band_name'] == custom['FILTER'][1]]['access_url'].values[0])
        bdata = get_fits_data(sia_df[sia_df['band_name'] == custom['FILTER'][2]]['access_url'].values[0])
        #Put together the colour image
        rimg = fits.open(rdata)[0]
        gimg = fits.open(gdata)[0]
        bimg = fits.open(bdata)[0]

        rdata = rimg.data
        gdata = gimg.data
        bdata = bimg.data

        rz = MinMaxInterval().get_limits(rdata)
        gz = MinMaxInterval().get_limits(gdata)
        bz = MinMaxInterval().get_limits(bdata)
        gamma = 1.0
        locut=70
        hicut=99.5
        #use multicolorfits (mcf) here to do the scaling and combination of the colour image
        gr = mcf.greyRGBize_image(rdata,min_max=[locut,hicut],rescalefn='asinh',scaletype='perc',gamma=gamma,checkscale=False)
        gg = mcf.greyRGBize_image(gdata,min_max=[locut,hicut],rescalefn='asinh',scaletype='perc',gamma=gamma,checkscale=False)
        gb = mcf.greyRGBize_image(bdata,min_max=[locut,hicut],rescalefn='asinh',scaletype='perc',gamma=gamma,checkscale=False)
        cr = mcf.colorize_image(gr,(0,0,255),colorintype='rgb',gammacorr_color=gamma)
        cg = mcf.colorize_image(gg,(0,255,0),colorintype='rgb',gammacorr_color=gamma)
        cb = mcf.colorize_image(gb,(255,0,0),colorintype='rgb',gammacorr_color=gamma)
        #use the green image for the WCS
        return (mcf.combine_multicolor([cr,cg,cb],gamma=gamma),WCS(gimg.header))
    else:
        return (None,None)


def get_fits_data(datalink):
    return BytesIO(requests.get(datalink).content)

def get_sia_image(sia_pos,sia_custom):
    #Use the AAO DataCentral SIA2 service
    sia_url = "https://datacentral.org.au/vo/sia2/query"
    sia_service = SIAService(sia_url)
    sia_results = sia_service.search(pos=sia_pos,**sia_custom)
    df = sia_results.votable.get_first_table().to_table(use_names_over_ids=True).to_pandas()
    link = df.loc[0,'access_url']
    #return the image data
    return BytesIO(requests.get(link).content)

url = "https://datacentral.org.au/vo/ssa/query"
service = SSAService(url)

fsize=[30,13]
mpl.rcParams['axes.linewidth'] = 0.7
FSIZE=8
LWIDTH=0.5
LABELSIZE=10

nrows = 4
ncolumns = 4

#As in the 6dF example, we will combine the results of two queries here.
#Instead of using target names, we will combine two different positions
#These could be read in from a file, but here we just have the coords list
indiv_results = []

coords = [(214,0),(217,0)]
for c in coords:
    pos = (c[0]*u.deg,c[1]*u.deg)
    custom = {}
    custom['SIZE'] = 0.3
    #only accept results with a positive redshift
    custom['REDSHIFT'] = '0/'
    custom['INSTRUMENT'] = '2dF-AAOmega'
    custom['COLLECTION'] = 'gama_dr2'
    results = service.search(pos=pos,**custom)

    #add only first 4 rows from each query
    indiv_results.append(results.votable.get_first_table().to_table(use_names_over_ids=True).to_pandas().head(4))
    #add all results
    #indiv_results.append(results.votable.get_first_table().to_table(use_names_over_ids=True).to_pandas())

#dataframe containing our combined results
df = pd.concat(indiv_results,ignore_index=True)

i = 0

plotidx = 0
PLOT=1
pdf = PdfPages('gama_spec.pdf')

#Number of spectra to plot
NSPEC = df.shape[0]
while plotidx < NSPEC:
    remaining = NSPEC - plotidx

    #setup a new plot for each grid of nrows by ncolumns spectra
    f = plt.figure(figsize=fsize)
    wr = [0.6]
    for w in range(0,ncolumns-1):
        wr.append(0.1)
    gs = gridspec.GridSpec(nrows,ncolumns,width_ratios=wr)
    gs.update(wspace=0.1)

    idx=0
    jdx=0
    print ("PLOT: ",PLOT)

    running = 0
    for idx in range(0,nrows):
        for jdx in range(0,ncolumns):
            if(running == remaining):
                break
            if(jdx == 0):
                #need to add RESPONSEFORMAT=fits here to get fits format returned
                url= df.loc[plotidx,'access_url'] + "&RESPONSEFORMAT=fits"
                print ("Downloading ",url)
                spec = Spectrum1D.read(BytesIO(requests.get(url).content),format='wcs1d-fits')
                z = df.loc[plotidx,'redshift']
                exptime = df.loc[plotidx,'t_exptime']

                ax = plt.subplot(gs[idx,jdx])
                ax.tick_params(axis='both', which='major', labelsize=FSIZE)
                ax.tick_params(axis='both', which='minor', labelsize=FSIZE)
                if(jdx == 0 and idx == nrows-1):
                   ax.set_xlabel("Rest Wavelength ($\mathrm{\AA}$)",fontsize=LABELSIZE,labelpad=10)
                   ax.set_ylabel("Intensity",fontsize=LABELSIZE,labelpad=20)
                waves = spec.wavelength/(1+z)
                #plot the spectrum as it is
                ax.plot(waves,spec.flux,linewidth=LWIDTH)
                #now work out the best y-axis range to plot
                #use sigma clipping to determine the limits, but exclude 1 per cent of the wavelength range
                #at each end of the spectrum (often affected by noise or other systematic effects)
                nspec = len(spec.spectral_axis)
                clipped = sigma_clip(spec[int(0+0.05*nspec):int(nspec-0.05*nspec)].flux,masked=False,sigma=10)
                ymin = min(clipped).value
                ymax = max(clipped).value
                xmin = waves[0].value
                xmax = waves[nspec-1].value
                #add a 1% buffer either side of the x-range
                dx=0.01*(xmax-xmin)
                ax.set_xlim(xmin-dx,xmax+dx)
                #add a 1% buffer either side of the y-range
                dy=0.01*(ymax-ymin)
                ax.set_ylim(ymin-dy,ymax+dy)
                #set the revised y-range
                #ylims = ax.get_ylim()
                #plot Halpha and [OIII]
                #ax.plot([6563.2,6563.2],[ylims[0]-10,ylims[1]+10],'r--',linewidth=LWIDTH)
                #ax.plot([5006.74,5006.74],[ylims[0]-10,ylims[1]+10],'g--',linewidth=LWIDTH)
                #ax.set_ylim(ylims[0],ylims[1])
                target = "%s" % df.loc[plotidx,'target_name']
                tmid = Time(df.loc[plotidx,'t_midpoint'],format='mjd')
                tmid.format='isot'
                titre = "%s %s Z=%s EXP=%s s" % (target,tmid.value[:-4],z,int(exptime))
                ax.set_title(titre)

                plotidx = plotidx + 1

            if(jdx == 1):
                #we request 1 arcmin square images
                image_radius = 15.0/3600
                sia_pos = (df.loc[plotidx-1,'s_ra']*u.deg,df.loc[plotidx-1,'s_dec']*u.deg,image_radius*u.deg)
                sia_custom= {}
                #filters are in RGB order
                sia_custom['FILTER'] = ['i','r','g']
                sia_custom['FACILITY'] = 'VST'
                (rgb,wcs) = get_rgb_img(pos=sia_pos,custom=sia_custom)

                #filters are in RGB order
                #sia_custom['FILTER'] = ['i','r','g']
                #sia_custom['FACILITY'] = 'SDSS'
                #(rgb,wcs) = get_rgb_img(pos=sia_pos,custom=sia_custom)
                if(rgb is not None):
                    ax = plt.subplot(gs[idx,jdx],projection=wcs)
                    ax.coords[1].set_ticks_position('r')
                    ax.coords[1].set_ticklabel_position('r')
                    ax.coords[1].set_axislabel_position('r')
                    if(idx < nrows-1):
                        ax.coords[0].set_axislabel('')
                        ax.coords[0].set_auto_axislabel(False)
                    else:
                        ax.coords[0].set_axislabel('RA (J2000)')
                    if(running == NSPEC-1):
                        ax.coords[0].set_axislabel('RA (J2000)')
                    if(jdx < ncolumns-1):
                        ax.coords[1].set_axislabel('')
                        ax.coords[1].set_auto_axislabel(False)
                    else:
                        ax.coords[1].set_axislabel('Dec (J2000)')

                    if(idx ==0):
                        ax.set_title(sia_custom['FACILITY'])
                    ax.imshow(rgb,origin='lower')
                else:
                    ax =  plt.subplot(gs[idx,jdx])
                    missing = 'missing %s data' % sia_custom['FACILITY']
                    ax.set_title(missing)

            if(jdx == 2):
                #we request 1 arcmin square images
                image_radius = 15.0/3600
                sia_pos = (df.loc[plotidx-1,'s_ra']*u.deg,df.loc[plotidx-1,'s_dec']*u.deg,image_radius*u.deg)
                sia_custom= {}
                #filters are in RGB order
                sia_custom['FILTER'] = ['K','H','J']
               #sia_custom['FACILITY'] = 'UKIRT'
                sia_custom['FACILITY'] = 'VISTA'
                (rgb,wcs) = get_rgb_img(pos=sia_pos,custom=sia_custom)

                if(rgb is not None):
                    ax = plt.subplot(gs[idx,jdx],projection=wcs)
                    ax.coords[1].set_ticks_position('r')
                    ax.coords[1].set_ticklabel_position('r')
                    ax.coords[1].set_axislabel_position('r')
                    if(idx < nrows-1):
                        ax.coords[0].set_axislabel('')
                        ax.coords[0].set_auto_axislabel(False)
                    else:
                        ax.coords[0].set_axislabel('RA (J2000)')
                    if(running == NSPEC-1):
                        ax.coords[0].set_axislabel('RA (J2000)')
                    if(jdx < ncolumns-1):
                        ax.coords[1].set_axislabel('')
                        ax.coords[1].set_auto_axislabel(False)
                    else:
                        ax.coords[1].set_axislabel('Dec (J2000)')
                    if(idx ==0):
                        ax.set_title(sia_custom['FACILITY'])
                    ax.imshow(rgb,origin='lower')
                else:
                    ax =  plt.subplot(gs[idx,jdx])
                    missing = 'missing %s data' % sia_custom['FACILITY']
                    ax.set_title(missing)

            if(jdx == 3):
                #we request 1 arcmin square images
                image_radius = 15.0/3600
                sia_pos = (df.loc[plotidx-1,'s_ra']*u.deg,df.loc[plotidx-1,'s_dec']*u.deg,image_radius*u.deg)
                sia_custom= {}

                #filters are in RGB order
                sia_custom['FILTER'] = ['W4','W3','W2']
                sia_custom['FACILITY'] = 'WISE'
                (rgb,wcs) = get_rgb_img(pos=sia_pos,custom=sia_custom)

                if(rgb is not None):
                    ax = plt.subplot(gs[idx,jdx],projection=wcs)
                    ax.coords[1].set_ticks_position('r')
                    ax.coords[1].set_ticklabel_position('r')
                    ax.coords[1].set_axislabel_position('r')
                    if(idx < nrows-1):
                        ax.coords[0].set_axislabel('')
                        ax.coords[0].set_auto_axislabel(False)
                    else:
                        ax.coords[0].set_axislabel('RA (J2000)')
                    if(running == NSPEC-1):
                        ax.coords[0].set_axislabel('RA (J2000)')

                    if(jdx < ncolumns-1):
                        ax.coords[1].set_axislabel('')
                        ax.coords[1].set_auto_axislabel(False)
                    else:
                        ax.coords[1].set_axislabel('Dec (J2000)')
                    if(idx ==0):
                        ax.set_title(sia_custom['FACILITY'])
                    ax.imshow(rgb,origin='lower')
                else:
                    ax =  plt.subplot(gs[idx,jdx])
                    missing = 'missing %s data' % sia_custom['FACILITY']
                    ax.set_title(missing)


                running=running + 1
    pdf.savefig()
    #plt.show()
    plt.close()
    PLOT=PLOT+1

pdf.close()