HiPS: Image cutouts with radio survey contour overlays
Here we use the hips2fits service to extract image cutouts from a few HiPS format surveys.
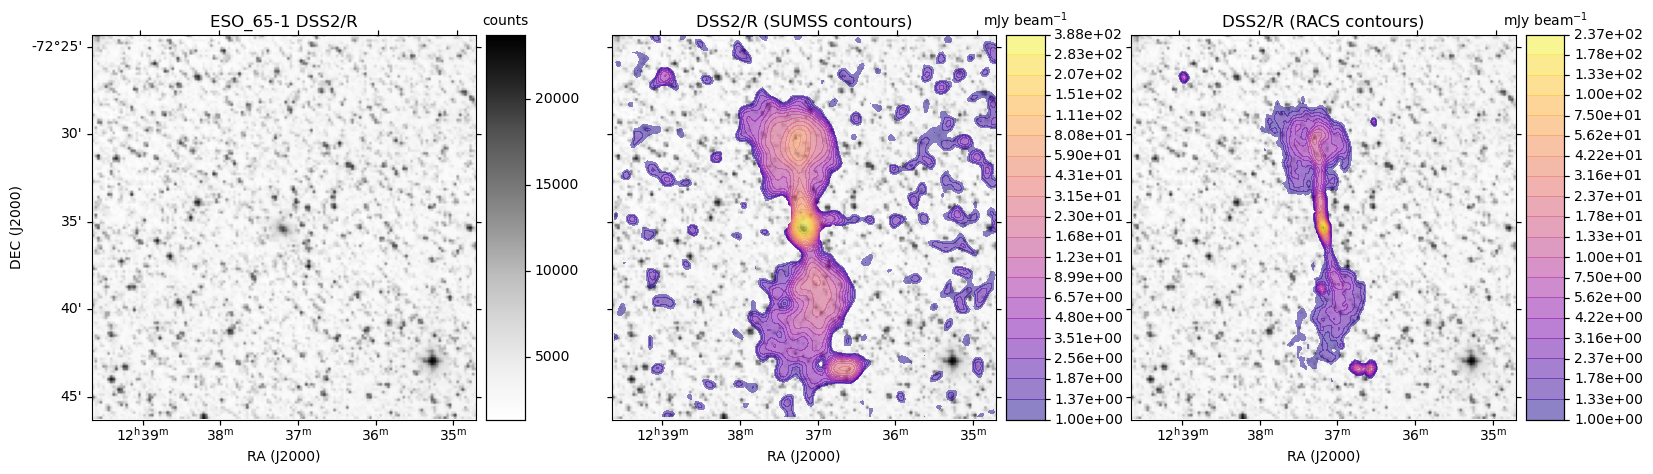
In the following Python script we first extract the base optical image in FITS format from the DSS2/R HiPS data.
We then extract the same from the SUMSS and ASKAP RACS survey HiPS data.
The HiPS data are located at http://alasky.u-strasbg.fr/SUMSS/ and https://www.atnf.csiro.au/research/RACS/RACS_I1/, respectively.
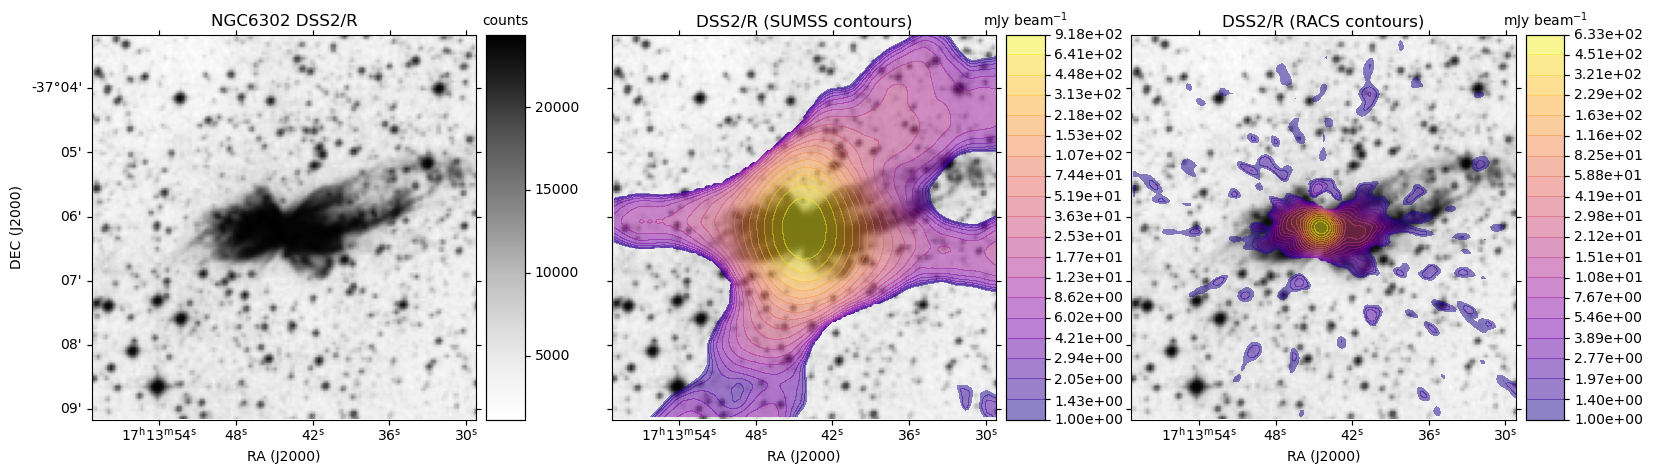
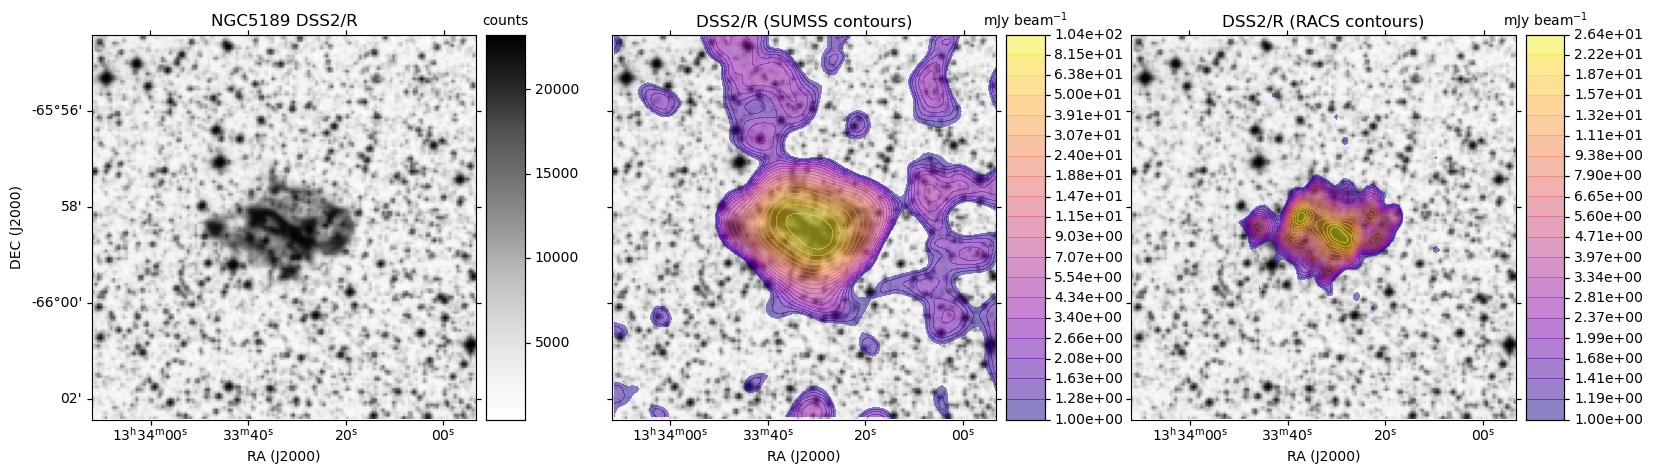
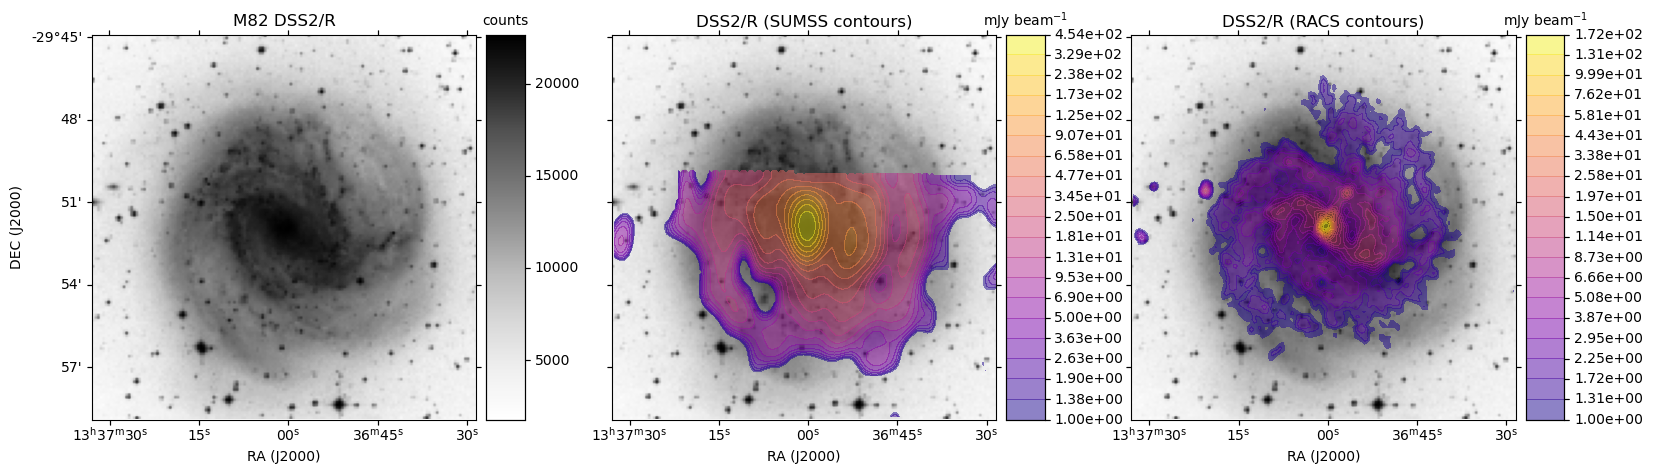
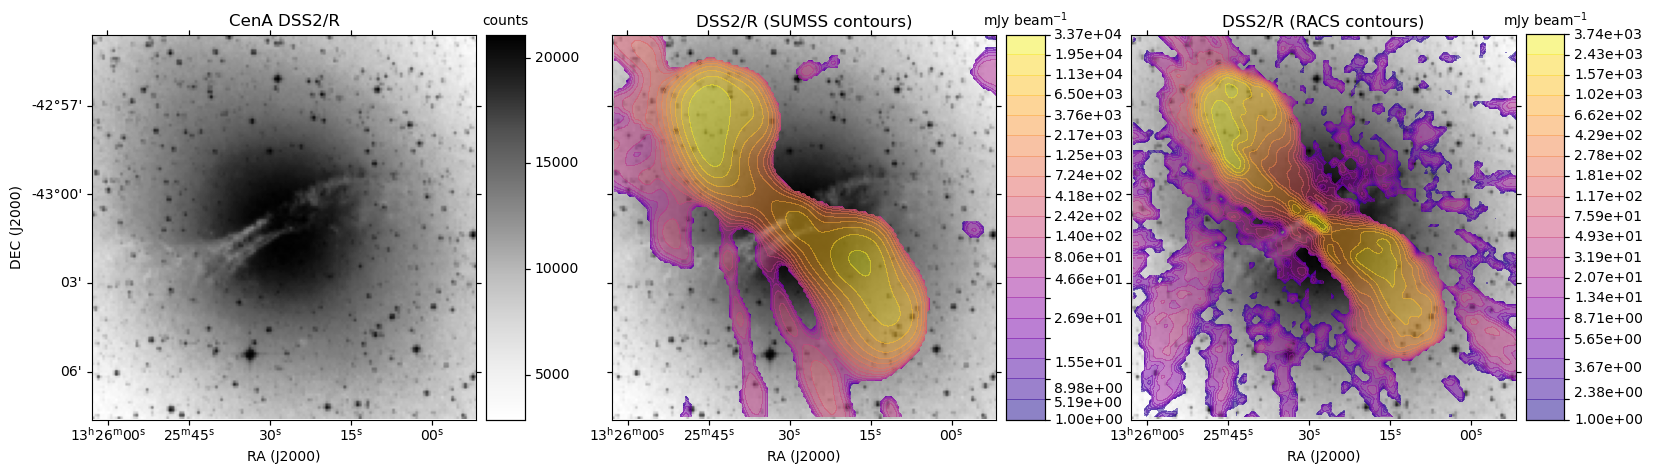
With all the data in hand, we use matplotlib to display the DSS2 R-band image:
- On its own
- With SUMSS contours as an overlay
- With ASKAP RACS contours as an overlay
A special note: This script is intended to be used as a convenient quick-look tool to check data for individual objects. As always, it's best to use the original data for any science applications.
Original data may be accessed from here (SUMSS) and here (RACS).
This example forms part of a series of General Virtual Observatory Examples developed by Data Central.
import matplotlib.pyplot as plt
import matplotlib as mpl
from matplotlib import gridspec
import numpy as np
import pandas as pd
from astropy.io import fits
from astropy.wcs import WCS
from mpl_toolkits.axes_grid1 import make_axes_locatable
from urllib.parse import quote
import matplotlib.image as mpimg
import requests
from io import BytesIO

from astropy.visualization import ImageNormalize, MinMaxInterval, AsinhStretch
from astropy import units as u

extra_hips = {
        'racs' : {'url' : 'https://www.atnf.csiro.au/research/RACS/RACS_I1/', 'order' : 8, 'label' : 'RACS'},
        'sumss' : {'url' : 'http://alasky.u-strasbg.fr/SUMSS/', 'order' : 6, 'label' : 'SUMSS'},
        #alternate url for sumss
        #'sumss' : {'url' : 'https://casda.csiro.au/hips/SUMSS', 'order' : 6, 'label' : 'SUMSS'},
        'nvss' :  {'url' : 'http://alasky.u-strasbg.fr/NVSS/intensity', 'order' : 5, 'label' : 'NVSS'},
}
#A function to make it easier to create a colorbar
#Adapted from https://joseph-long.com/writing/colorbars/
def colorbar(mappable,xlabel):
    last_axes = plt.gca()
    ax = mappable.axes
    fig = ax.figure
    divider = make_axes_locatable(ax)
    cax = divider.append_axes("right", size="10%", pad=0.1)
    #taking this approach to make a colorbar means the new axis is also of wcsaxes type
    #https://docs.astropy.org/en/stable/visualization/wcsaxes/
    #the following fixes up some issues and formats the colorbar
    cax.grid(False)
    cbar = fig.colorbar(mappable, cax=cax)
    cbar.ax.coords[1].set_ticklabel_position('r')
    cbar.ax.coords[1].set_auto_axislabel(False)
    cbar.ax.coords[0].set_ticks_visible(False)
    cbar.ax.coords[0].set_ticklabel_visible(False)
    cbar.ax.coords[1].set_axislabel(xlabel)
    cbar.ax.coords[1].set_axislabel_position('t')
    cbar.ax.coords[1].set_ticks_position('r')
    if(hasattr(mappable,'levels')):
        cbar.ax.coords[1].set_ticks(mappable.levels*u.dimensionless_unscaled)
        cbar.ax.coords[1].set_major_formatter('%.2e')
        #cbar.ax.coords[1].set_major_formatter('%.2f')
        cbar.ax.coords[1].set_ticklabel(exclude_overlapping=True)
    plt.sca(last_axes)
    return cbar

#A function to access the hips2fits service
#if the image is not empty, return the fits hdu
def get_hips_data(hips,pix_width, pix_height, diam, qra, qdec):
    url = 'http://alasky.u-strasbg.fr/hips-image-services/hips2fits?hips={}&width={}&height={}&fov={}&projection=TAN&coordsys=icrs&ra={}&dec={}&rotation_angle=0.0&format=fits'.format(quote(hips), pix_width, pix_height, diam*1.0/3600, qra, qdec)
    resp = requests.get(url)
    if(resp.status_code < 400):
        hdu = fits.open(BytesIO(resp.content))
        im = hdu[0].data
        if (not np.isnan(im[0][0])):
            return hdu
    else:
        return None

#A function to make each of the individual plots
#cnum = number of filled contour levels
#calpha = transparency of filled contours
def make_plot(ax,img,cimg,imlabel,clabel,pos,cnum = 20,calpha=0.5):
    #depending on where the image lies in the sequence (left, middle or right)
    #format the axes appropriately
    if(pos == 'l'):
        ax.coords[0].set_axislabel('RA (J2000)')
        ax.coords[1].set_axislabel('DEC (J2000)')

    if(pos == 'r'):
        ax.coords[1].set_ticklabel_position('r')
        ax.coords[1].set_axislabel_position('r')
        ax.coords[0].set_axislabel('RA (J2000)')
        ax.coords[1].set_axislabel('')
        ax.coords[1].set_auto_axislabel(False)
        ax.coords[1].set_ticklabel_visible(False)

    if(pos == 'm'):
         ax.coords[1].set_axislabel('')
         ax.coords[1].set_auto_axislabel(False)
         ax.coords[0].set_axislabel('RA (J2000)')
         ax.coords[1].set_ticklabel_visible(False)

    #plot the base image
    norm = ImageNormalize(img, interval=MinMaxInterval(),stretch=AsinhStretch())
    im = ax.imshow(img, cmap='Greys', norm=norm, origin='lower',aspect='auto')
    #add a colorbar from the base image if there is not a contour overlay to show
    if(cimg is None):
        #Add the colorbar and title
        colorbar(im,'counts')
        titre = imlabel
        ax.set_title(titre)
    else:
        #Get the min and max values from the contour image, ignoring nan values
        cmin = np.nanmin(cimg)
        cmax = np.nanmax(cimg)
        #If we have negative values, use a small number for the minimum
        if(cmin < 0):
            #1.0 mJy per beam
            cmin = 1e-3*1000
        #Determine the contours spaced equally in logspace
        cmin = np.log10(cmin)
        cmax = np.log10(cmax)
        clevels = np.logspace(cmin,cmax,cnum)
        #Choose a colour map
        cmap = mpl.cm.get_cmap('plasma')
        #Ensure that the full colour range is used via LogNorm
        norm = mpl.colors.LogNorm(vmin=10**cmin,vmax=10**cmax)
        #Create filled contours. Another option
        CS = ax.contourf(cimg,levels=clevels,cmap=cmap,alpha=calpha,norm=norm,origin='lower')
        #Add the colorbar and title
        colorbar(CS,'mJy beam$^{-1}$')
        titre = imlabel + " (%s contours)" % (clabel)
        ax.set_title(titre)

#The figure size was chosen to ensure square images
fsize=[19,5]

#A list of targets we want to create images for
#ra (deg),dec (deg),diameter (arcmin)
targets = [
('ESO_65-1',189.2989130,-72.5906310,22),
('NGC5189',203.3869913,-65.97417749,8),
('NGC6337',260.56530073,-38.48381531,4),
('NGC6302',258.4347458,-37.1030416,6),
('M82',204.25382917,-29.86576111,14),
('CenA',201.36506288,-43.01911267,13),
]

#width of images in pixels (used by hips2fits service)
pw = 150
ph = pw
#For each target, create a separate plot
for targ in targets:
    name = targ[0]
    ra = targ[1]
    dec = targ[2]
    diam = targ[3]*60
    print (name,ra,dec)

    #first get the fits data
    base_hips = 'DSS2/R'
    print ("Getting ",base_hips)
    hdu_dss = get_hips_data(base_hips,pw,ph,diam,ra,dec)

    print ("Getting RACS")
    hdu_racs = get_hips_data(extra_hips['racs']['url'],pw,ph,diam,ra,dec)

    print ("Getting SUMSS")
    hdu_sumss = get_hips_data(extra_hips['sumss']['url'],pw,ph,diam,ra,dec)
    #hdu_nvss = get_hips_data(extra_hips['nvss']['url'],pw,ph,diam,ra,dec)

    #if we have no data for one of the surveys, skip it
    if(hdu_dss is None or hdu_racs is None or hdu_sumss is None):
        continue

    #get the image data
    im_dss = hdu_dss[0].data
    #multiply by 1000 to convert Jy/beam to mJy/beam
    im_racs = hdu_racs[0].data*1000
    im_sumss = hdu_sumss[0].data*1000
    #use the DSS image WCS for the projection for each panel
    custom = {}
    custom['projection'] = WCS(hdu_dss[0].header)
    #setup a plot with three panels side by side
    f, (ax1,ax2,ax3) = plt.subplots(figsize=fsize,ncols=3,subplot_kw=custom)

    #make each plot
    name_label = name + ' ' + base_hips
    make_plot(ax1,im_dss,None,name_label,'',pos='l')
    make_plot(ax2,im_dss,im_sumss,base_hips,'SUMSS',pos='m')
    make_plot(ax3,im_dss,im_racs,base_hips,'RACS',pos='r')

    #save to png; could also save to pdf or eps here
    fname = name + '.png'
    print ('Saving ',fname)
    plt.savefig(fname,bbox_inches='tight')
    plt.close()
    hdu_dss.close()
    hdu_racs.close()
    hdu_sumss.close()