
SSA: Accessing the Original Spectra
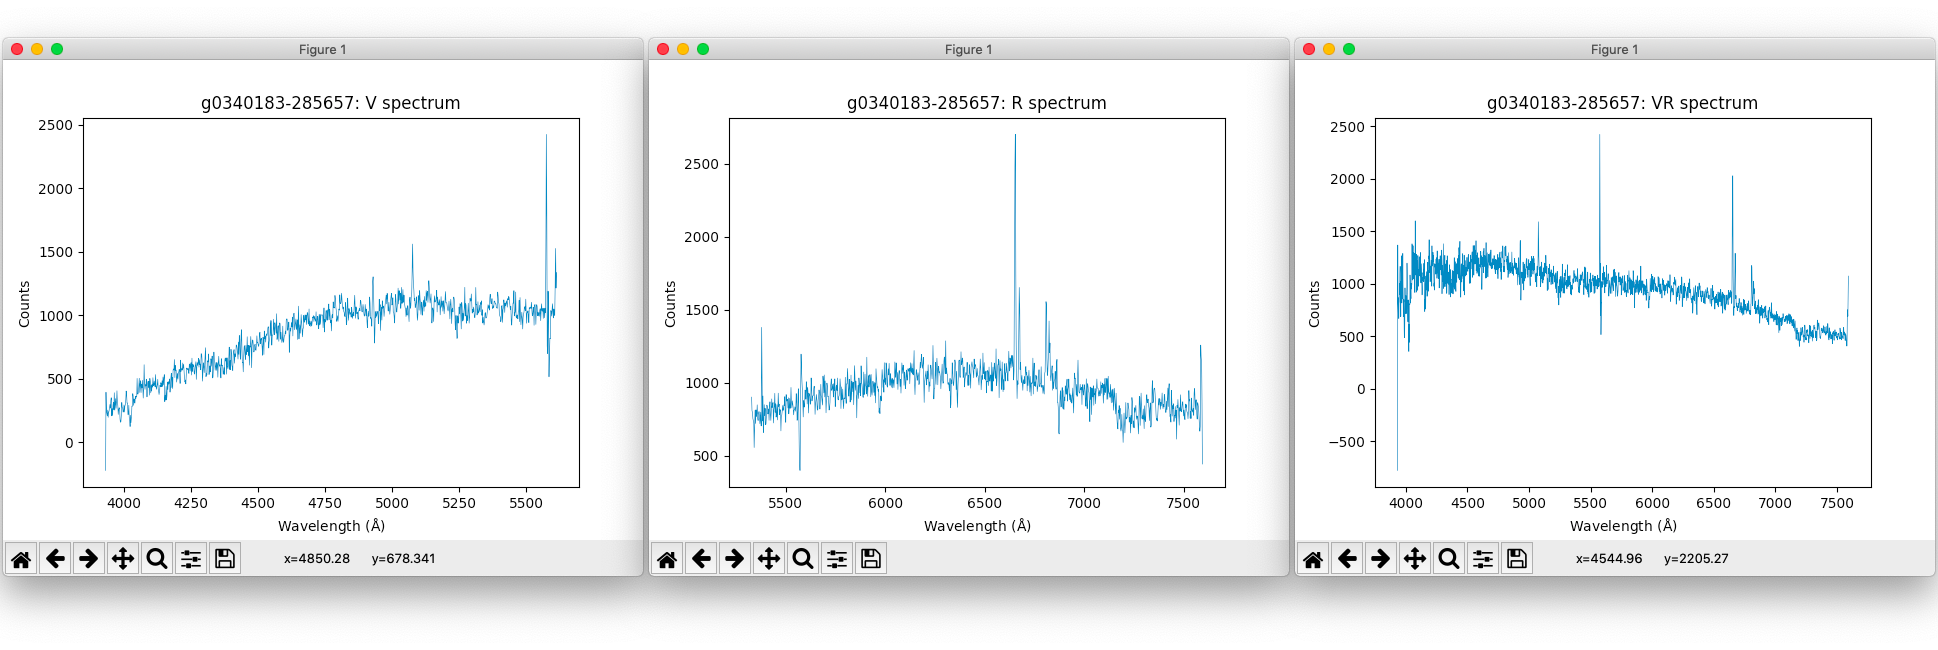
Example plots of g0340183-285657 using the specutils 6dFGS-combined loader
Typically users will only need to access the simplified spectra using the access_url links (see the FITS FORMAT section of the SSA page for full details).
In the following example we perform the same query as in SSA: Retrieving and Parsing a VOTable but instead use the 6dFGS-combined loader within the specutils package to access the original spectra.
from astropy.io.votable import parse_single_table
import requests
from io import BytesIO
from astropy.time import Time
from specutils import SpectrumList
import re
import matplotlib.pyplot as plt

#SSA query URL
#query 6dF final data release only around RA=55 deg, DEC=-29.1 deg in a circle of 0.4 deg diameter
url = "https://datacentral.org.au/vo/ssa/query?POS=55,-29.1&SIZE=0.4&REQUEST=queryData&COLLECTION=6dfgs_fdr"

#perform the query via the above url and store contents in vot
vot = requests.get(url).content
#optionally write table to file
#fptr = open("ssa_table.xml","wb")
#fptr.write(vot)
#fptr.close()

#open the table with astropy's votable package
table = parse_single_table(BytesIO(vot))
data = table.array

#A dictionary to keep track of target_name and urls to original fits file
urls = {}

#Go through each row in the table
for i in range (0,len(data)):
    target_name = data['target_name'][i]
    #Note that the SSA service returns results on all spectra available
    #i.e. all spectra contained in original files are included in the results
    #so the full (original) spectrum they were extracted from appears multiple times
    #in the VOTable results under the full_data_url column
    if(target_name not in urls):
        #Add to our dictionary if not already added before
        #Note the addition of RESPONSEFORMAT=fits here to ensure
        #the results are returned in fits format
        urls[target_name] = data['full_data_url'][i] + "&RESPONSEFORMAT=fits"

#width of line to use in matplotlib
LWIDTH=0.5

#Go through each of the full (original) spectra
#and plot in a simple way the V, R and VR spectra
for target, u in urls.items():
    print (target,u)
    ofname = "%s.fits" % target
    print ("Downloading ",ofname)
    spec = requests.get(u).content
    #write out the spectrum to a file
    fptr = open(ofname,"wb")
    fptr.write(spec)
    fptr.close()
    #Load in the spectra using specutils and the 6dFGS-combined loader
    slist = SpectrumList.read(BytesIO(spec),format='6dFGS-combined')
    nspec = len(slist)
    for idx in range(0,nspec):
        hdr = slist[idx].meta['header']
        band = re.sub('SPECTRUM ','',hdr['EXTNAME'])
        wave = slist[idx].wavelength
        flux = slist[idx].flux
        plt.plot(wave,flux,linewidth=LWIDTH)
        titre = "%s: %s spectrum" % (target,band)
        plt.title(titre)
        plt.xlabel("Wavelength ($\mathrm{\AA}$)")
        plt.ylabel("Counts")
        plt.show()