
SSA: 6dF Galaxy Survey Spectra and Image Cutouts from Target Names
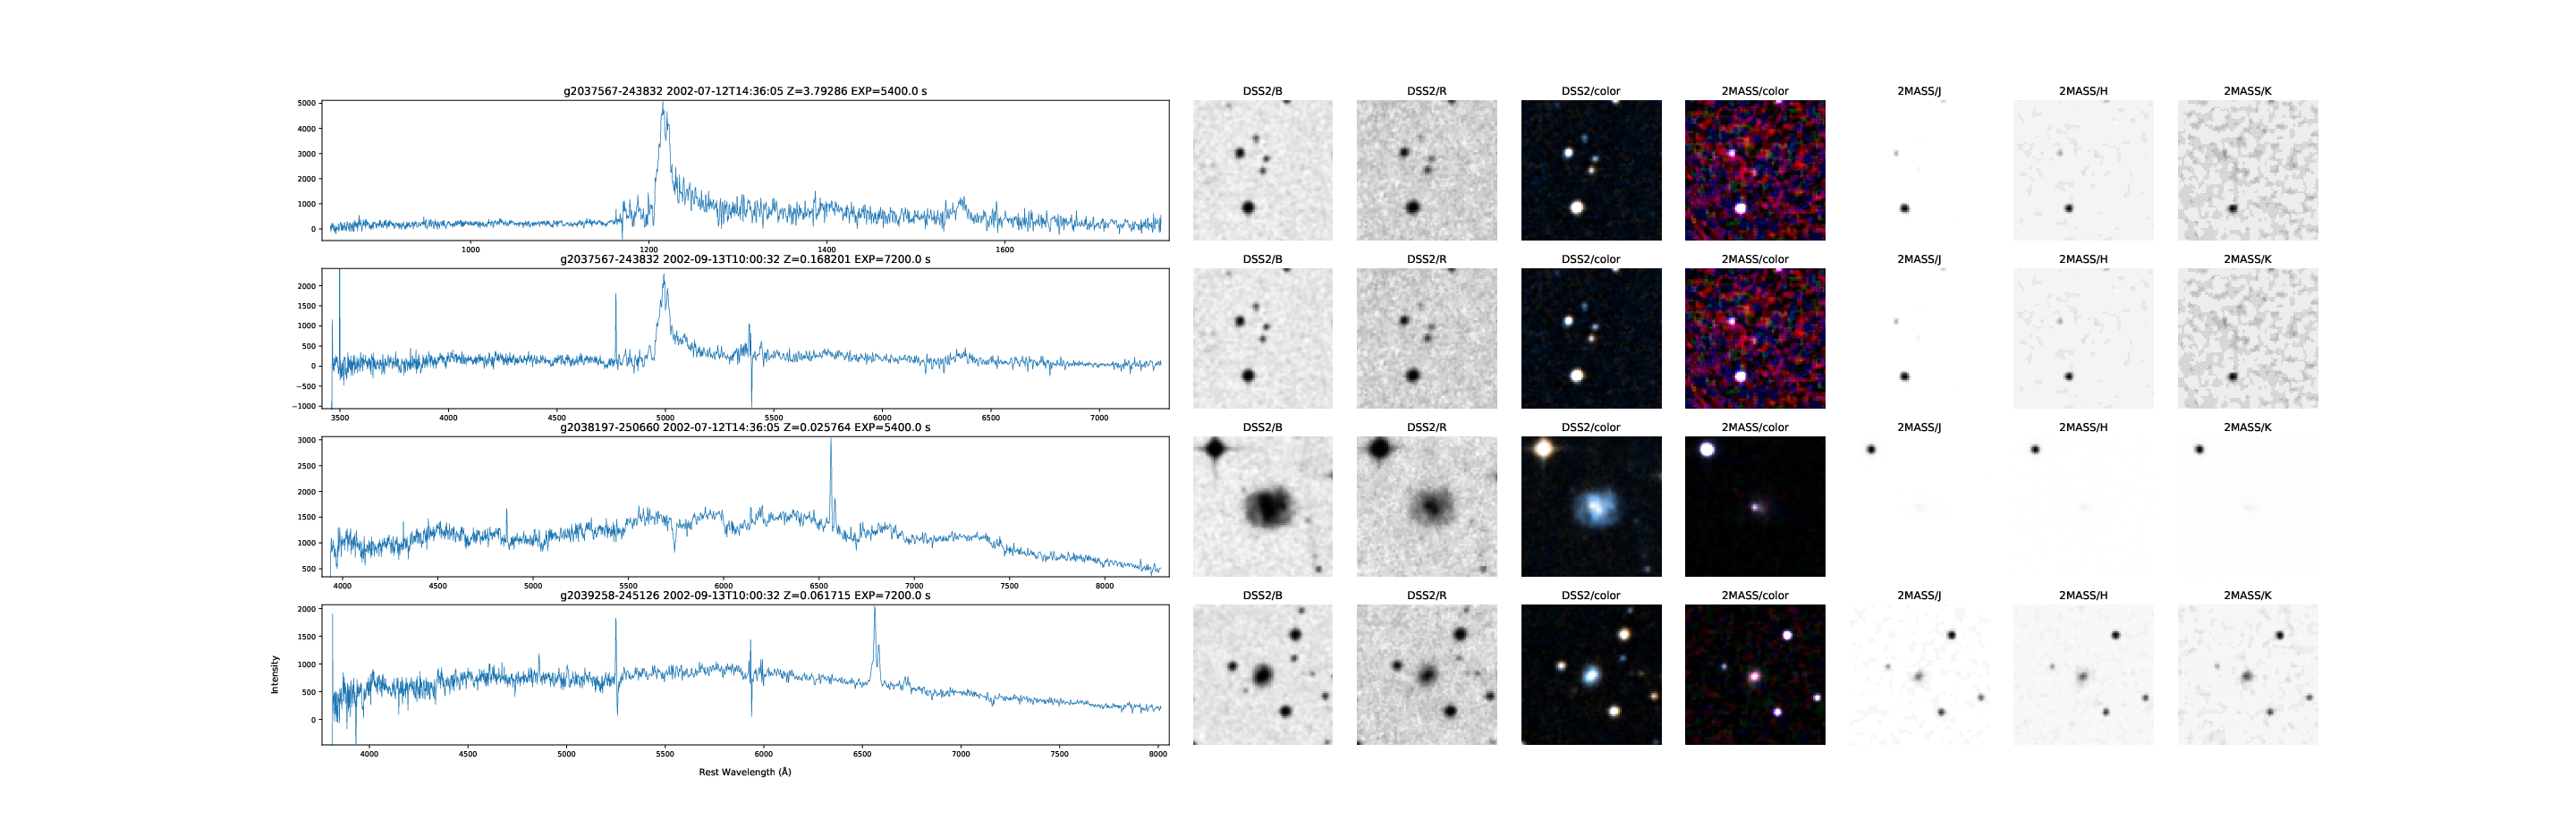
6dfgs_fdr spectra for three targets and their DSS and 2MASS image cutouts. The first target has a second observation with an incorrect redshift.
This example retrieves some 6dF Galaxy Survey spectra together with some image cutouts for the galaxy positions using the hips2fits service.
from astropy.coordinates import SkyCoord
from specutils import Spectrum1D, SpectrumList
from urllib.request import urlopen,urlretrieve
from astropy.io.votable import parse_single_table, parse
import matplotlib.pyplot as plt
import matplotlib as mpl
from matplotlib.backends.backend_pdf import PdfPages
from matplotlib import gridspec
import numpy as np
import pandas as pd
from astropy.io import fits
from astropy.wcs import WCS
from astropy.stats import sigma_clip
import multicolorfits as mcf
from urllib.parse import quote
from astropy.time import Time
import matplotlib.image as mpimg
import requests
from io import BytesIO

from astropy.visualization import ZScaleInterval, ImageNormalize, MinMaxInterval, AsinhStretch

from astropy import units as u
from pyvo.dal.ssa  import search, SSAService

def get_hips_color(hips,pix_width, pix_height, diam, qra, qdec):
    #get a colour image
    print ("Retrieving hips colour image from ",hips)
    url = 'http://alasky.u-strasbg.fr/hips-image-services/hips2fits?hips={}&width={}&height={}&fov={}&projection=TAN&coordsys=icrs&ra={}&dec={}&rotation_angle=0.0&format=png'.format(quote(hips), pix_width, pix_height, diam*1.0/3600, qra, qdec)
    return mpimg.imread(BytesIO(requests.get(url).content))

def get_hips(ax,hips,pix_width, pix_height, diam, qra, qdec):
    print ("Retrieving hips image from ",hips)
    url = 'http://alasky.u-strasbg.fr/hips-image-services/hips2fits?hips={}&width={}&height={}&fov={}&projection=TAN&coordsys=icrs&ra={}&dec={}&rotation_angle=0.0&format=fits'.format(quote(hips), pix_width, pix_height, diam*1.0/3600, qra, qdec)
    resp = requests.get(url)
    #if qra and qdec are missing from the hips data, an empty image full of nans is returned
    #If this is the case, we add a blank grey image with a label 'No data'
    if(resp.status_code < 400):
        hdu = fits.open(BytesIO(resp.content))
        im = hdu[0].data
        if (not np.isnan(im[0][0])):
            norm = ImageNormalize(im, interval=MinMaxInterval(),stretch=AsinhStretch())
            ax.imshow(im, cmap='Greys', norm=norm, origin='lower')
            ax.axis('off')
        else:
            #150 here is grey
            ax.imshow(np.full((pix_width,pix_height,3),150,dtype=np.uint8))
            style = dict(size=12,color='black')
            ax.text(pix_width*0.5,pix_height*0.5,'No data',ha='center',**style)
            ax.axis('off')
        hdu.close()
    else:
        #150 here is grey
        ax.imshow(np.full((pix_width,pix_height,3),150,dtype=np.uint8))
        style = dict(size=12,color='black')
        ax.text(pix_width*0.5,pix_height*0.5,'No data',ha='center',**style)
        ax.axis('off')

url = "https://datacentral.org.au/vo/ssa/query"
service = SSAService(url)
qra=55
qdec=-29.1

#set the figure size to be wide in the horizontal direction
#to accommodate the image cutouts alongside the spectra
fsize=[40,13]
mpl.rcParams['axes.linewidth'] = 0.7
FSIZE=8
LWIDTH=0.5
LABELSIZE=10

nrows = 4
#13 cols needed for WISE
#showWISE=True
showWISE=False
ncolumns = 8
if(showWISE):
    ncolumns = 13

indiv_results = []
targets = ['g2037567-243832','g2038197-250660','g2039258-245126']

#since SSA does not support more than one value per each parameter
#to query multiple targets we perform separate queries
#and append the results to indiv_results in the form of pandas dataframes
#Once done, we can concatenate the results into a single dataframe
#that makes processing the results a lot easier
#Note that we exclude the pos parameter here, since we are using the targetname
#and we only request the VR (combined) spectra
for t in targets:
    custom = {}
    custom['FILTER'] = 'VR'
    custom['TARGETNAME'] = t
    custom['COLLECTION'] = '6dfgs_fdr'
    results = service.search(**custom)
    indiv_results.append(results.votable.get_first_table().to_table(use_names_over_ids=True).to_pandas())

#dataframe containing all our results
df = pd.concat(indiv_results,ignore_index=True)

i = 0

plotidx = 0
PLOT=1
pdf = PdfPages('spec.pdf')

#Number of spectra to plot
NSPEC = df.shape[0]

#params for hips2fits
pix_width=150
pix_height=pix_width
diam=90


while plotidx < NSPEC:
    remaining = NSPEC - plotidx
    #setup a new plot for each grid of nrows by ncolumns spectra
    f = plt.figure(figsize=fsize)
    #We use gridspec to lay out the expected number of elements
    wr = [0.6]
    for w in range(0,ncolumns-1):
        wr.append(0.1)
    gs = gridspec.GridSpec(nrows,ncolumns,width_ratios=wr)
    gs.update(wspace=0.1)

    idx=0
    jdx=0
    print ("PLOT: ",PLOT)

    running = 0
    for idx in range(0,nrows):
        for jdx in range(0,ncolumns):
            if(running == remaining):
                break
            if(jdx == 0):
                #need to add RESPONSEFORMAT=fits here to get fits format returned
                url= df.loc[plotidx,'access_url'] + "&RESPONSEFORMAT=fits"
                print ("Downloading ",url)
                spec = Spectrum1D.read(BytesIO(requests.get(url).content),format='wcs1d-fits')
                z = df.loc[plotidx,'redshift']
                exptime = df.loc[plotidx,'t_exptime']

                ax = plt.subplot(gs[idx,jdx])
                ax.tick_params(axis='both', which='major', labelsize=FSIZE)
                ax.tick_params(axis='both', which='minor', labelsize=FSIZE)
                if(jdx == 0 and (idx == nrows-1 or idx == NSPEC-1)):
                   ax.set_xlabel("Rest Wavelength ($\mathrm{\AA}$)",labelpad=10)
                   ax.set_ylabel("Intensity",labelpad=20)
                #plot the spectrum as it is
                ax.plot(spec.wavelength/(1+z),spec.flux,linewidth=LWIDTH)
                #now work out the best y-axis range to plot
                #use sigma clipping to determine the limits, but exclude 1 per cent of the wavelength range
                #at each end of the spectrum (often affected by noise or other systematic effects)
                nspec = len(spec.spectral_axis)
                clipped = sigma_clip(spec[int(0+0.01*nspec):int(nspec-0.01*nspec)].flux,masked=False,sigma=10)
                ymin = min(clipped).value
                ymax = max(clipped).value
                #print ("ymin/ymax: ",ymin,ymax)
                #xlims = ax.get_xlim()
                xmin = spec.wavelength[0].value/(1+z)
                xmax = spec.wavelength[nspec-1].value/(1+z)
                #add a 1% buffer either side of the x-range
                dx=0.01*(xmax-xmin)
                ax.set_xlim(xmin-dx,xmax+dx)
                #add a 1% buffer either side of the y-range
                dy=0.01*(ymax-ymin)
                ax.set_ylim(ymin-dy,ymax+dy)
                target = "%s" % df.loc[plotidx,'target_name']
                tmid = Time(df.loc[plotidx,'t_midpoint'],format='mjd')
                tmid.format='isot'
                titre = "%s %s Z=%s EXP=%s s" % (target,tmid.value[:-4],z,exptime)
                ax.set_title(titre)

                plotidx = plotidx + 1

            #add the image cutouts
            #see https://aladin.u-strasbg.fr/hips/list for a full list of hips data
            if(jdx == 1):
                ax = plt.subplot(gs[idx,jdx])
                hips="DSS2/B"
                get_hips(ax,hips,pix_width, pix_height, diam, df.loc[plotidx-1,'s_ra'], df.loc[plotidx-1,'s_dec'])
                ax.set_title(hips)
            if(jdx == 2):
                ax = plt.subplot(gs[idx,jdx])
                hips="DSS2/R"
                get_hips(ax,hips,pix_width, pix_height, diam, df.loc[plotidx-1,'s_ra'], df.loc[plotidx-1,'s_dec'])
                ax.set_title(hips)

            if(jdx == 3):
                ax = plt.subplot(gs[idx,jdx])
                hips = "DSS2/color"
                ax.imshow(get_hips_color(hips,pix_width, pix_height, diam, df.loc[plotidx-1,'s_ra'], df.loc[plotidx-1,'s_dec']))
                ax.set_title(hips)
                ax.axis('off')
            if(jdx == 4):
                ax = plt.subplot(gs[idx,jdx])
                hips = "2MASS/color"
                ax.imshow(get_hips_color(hips,pix_width, pix_height, diam, df.loc[plotidx-1,'s_ra'], df.loc[plotidx-1,'s_dec']))
                ax.set_title(hips)
                ax.axis('off')
            if(jdx == 5):
                ax = plt.subplot(gs[idx,jdx])
                hips="2MASS/J"
                get_hips(ax,hips,pix_width, pix_height, diam, df.loc[plotidx-1,'s_ra'], df.loc[plotidx-1,'s_dec'])
                ax.set_title(hips)
            if(jdx == 6):
                ax = plt.subplot(gs[idx,jdx])
                hips="2MASS/H"
                get_hips(ax,hips,pix_width, pix_height, diam, df.loc[plotidx-1,'s_ra'], df.loc[plotidx-1,'s_dec'])
                ax.set_title(hips)
            if(jdx == 7):
                ax = plt.subplot(gs[idx,jdx])
                hips="2MASS/K"
                get_hips(ax,hips,pix_width, pix_height, diam, df.loc[plotidx-1,'s_ra'], df.loc[plotidx-1,'s_dec'])
                ax.set_title(hips)
            if(showWISE and jdx == 8):
                ax = plt.subplot(gs[idx,jdx])
                hips="allWISE/W1"
                get_hips(ax,hips,pix_width, pix_height, diam, df.loc[plotidx-1,'s_ra'], df.loc[plotidx-1,'s_dec'])
                ax.set_title(hips)
            if(showWISE and jdx == 9):
                ax = plt.subplot(gs[idx,jdx])
                hips="allWISE/W2"
                get_hips(ax,hips,pix_width, pix_height, diam, df.loc[plotidx-1,'s_ra'], df.loc[plotidx-1,'s_dec'])
                ax.set_title(hips)
            if(showWISE and jdx == 10):
                ax = plt.subplot(gs[idx,jdx])
                hips="allWISE/W3"
                get_hips(ax,hips,pix_width, pix_height, diam, df.loc[plotidx-1,'s_ra'], df.loc[plotidx-1,'s_dec'])
                ax.set_title(hips)
            if(showWISE and jdx == 11):
                ax = plt.subplot(gs[idx,jdx])
                hips="allWISE/W4"
                get_hips(ax,hips,pix_width, pix_height, diam, df.loc[plotidx-1,'s_ra'], df.loc[plotidx-1,'s_dec'])
                ax.set_title(hips)
            if(showWISE and jdx == 12):
                ax = plt.subplot(gs[idx,jdx])
                hips = "allWISE/color"
                ax.imshow(get_hips_color(hips,pix_width, pix_height, diam, df.loc[plotidx-1,'s_ra'], df.loc[plotidx-1,'s_dec']))
                ax.set_title(hips)
                ax.axis('off')

                running=running + 1
    pdf.savefig()
    #plt.show()
    plt.close()
    PLOT=PLOT+1

pdf.close()