
Download images and spectra of galaxies that are not in a group and in an overdensity using GAMA
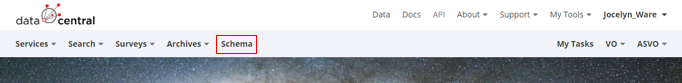
In order to obtain these images a table of objects that obey these bounds must be acquired. To obtain the data a catalogue query needs to be done. Use the schema find appropriate variables that fit the requirements.
There is some sample code below which draws data from four different tables within the same survey.
SELECT
t1.CATAID,
t1.GroupID,
t2.fluxscale,
t2.logmstar,
t3.SurfaceDensity,
t4.SPECID,
t4.URL_IMG
FROM gama_dr2.G3CGal as t1
INNER JOIN gama_dr2.StellarMasses as t2 on t2.CATAID = t1.CATAID
INNER JOIN gama_dr2.EnvironmentMeasures as t3 on t3.CATAID = t1.CATAID
INNER JOIN gama_dr2.SpecAll as t4 on t4.CATAID = t1.CATAID
WHERE t1.GroupID = 0
AND t3.SurfaceDensity > 5
AND (t2.logmstar + LOG10(t2.fluxscale) - 2*LOG10(0.67/0.7)) > 10
This Catalogue Query produces the following table:
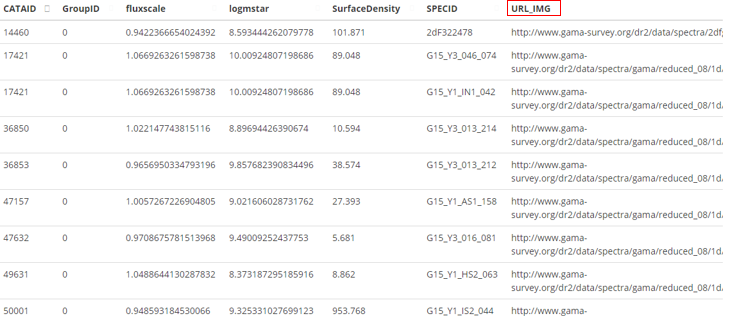
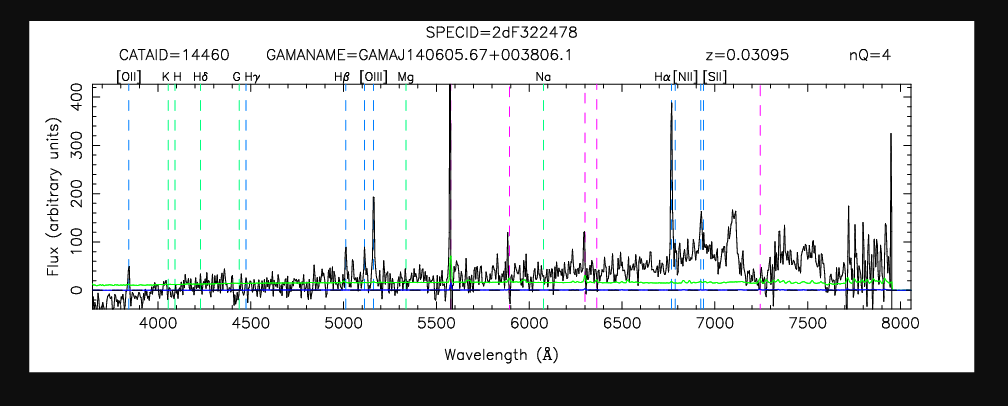
Follow the link in the right column to obtain the 1-D spectra. It should look similar to this.
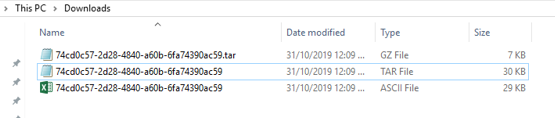
To obtain the images of all objects you will need to download the table.

Download the table using one of the boxes, we recommend ascii or CSV. You will need to unzip the downloaded document, potentially twice. We recommend that you open it in excel since it is the easiest way to show clear columns.
Open the excel document.

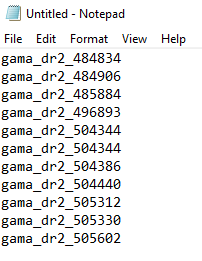
The column of CATAID is the names of each source that you want to use. In the same excel worksheet in a new column type ‘= “gama_dr2_” & B2’, this step reduces the amount of coding that has to be done, drag that first box down until it covers all CATAID numbers. Copy that new column into a new notepad document such that it is only one column and save such that it is a .txt file.
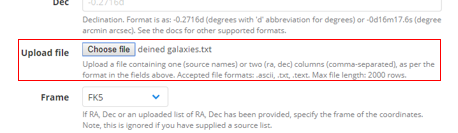
Back onto the website, upload this file into Image Cutout.
Tick the greyscale box and chose the r related lines below, you can select multiple lines by using control.Since we want a three colour image tick the box ‘RGB’ (Red Green Blue). We recommend that under ‘Plot Options’ include the plot title, this helps to show which graph is which. To produce a fits file tick the box ‘fits’ under ‘Additional Options’, this will allow you to download the produced images as fits images, expect for the coloured image which can only be a .PNG file. If you haven’t signed in then add your email and press the ‘queue’ button. After the request has been processed it will produce a series of images that you can download as either fits or png files by clicking on the respective button at the bottom of each image.
