SAMI Target Selection
The SAMI Galaxy Survey is designed to address the following three key questions about galaxy evolution:
- What is the physical role of environment in galaxy evolution?
- What is the interplay between gas flows and galaxy evolution?
- How are mass and angular momentum built up in galaxies?
This naturally requires covering a broad range of stellar masses and environments. To reach this goal the galaxies targeted by the SAMI Galaxy Survey have been selected from two distinct parent samples: the GAMA survey and a sample of eight nearby clusters. The clusters were added to guarantee that we map all galactic environments and do not miss the most dense structures, which are undersampled in the GAMA survey. The SAMI Galaxy Survey target selection is described in detail in Bryant et al. (2015) and Owers et al. (2017).
1. The SAMI-GAMA sample
Non-cluster SAMI targets have been extracted from the three equatorial fields included in the GAMA redshift survey (Driver et al. 2009). In addition to providing a unique map of the large scale structure of the local Universe, GAMA brings together a unique suite of multi wavelength data from the ultraviolet to the far-infrared increasing the legacy value of SAMI. The SAMI galaxies selected from the GAMA survey consist of four volume-limited samples from a stepped series of stellar mass cuts in redshift bands, along with additional dwarf galaxy candidates with low stellar mass and low redshift. Due to tiling constraints and source distributions some field configurations may not have 12 primary targets, therefore secondary targets were also defined. The table below outlines the selection criteria used to isolate primary and secondary SAMI targets. Redshifts are adjusted to the Tonry et al. 2000 flow model.
| Redshift Range | $M_\star (M_\odot)$ |
|---|---|
| Primary Targets | |
| $0.004<z\leq0.02$ | $\geq7+60z$ |
| $0.02<z\leq0.03$ | $\geq8.2$ |
| $0.03<z\leq0.045$ | $\geq9.0$ |
| $0.045<z\leq0.06$ | $\geq10.0$ |
| $0.06<z\leq0.095$ | $\geq10.9$ |
| Secondary Targets | |
| $0.03<z\leq0.045$ | $\geq8.6$ |
| $0.045<z\leq0.06$ | $\geq9.4$ |
| $0.06<z\leq0.095$ | $\geq10.3$ |
| $0.095<z\leq0.115$ | $\geq10.9$ |
The total number of galaxies included in the sample is composed of 2404 primary and 2513 secondary targets. More details on the sample selection can be found in Bryant et al. (2015).
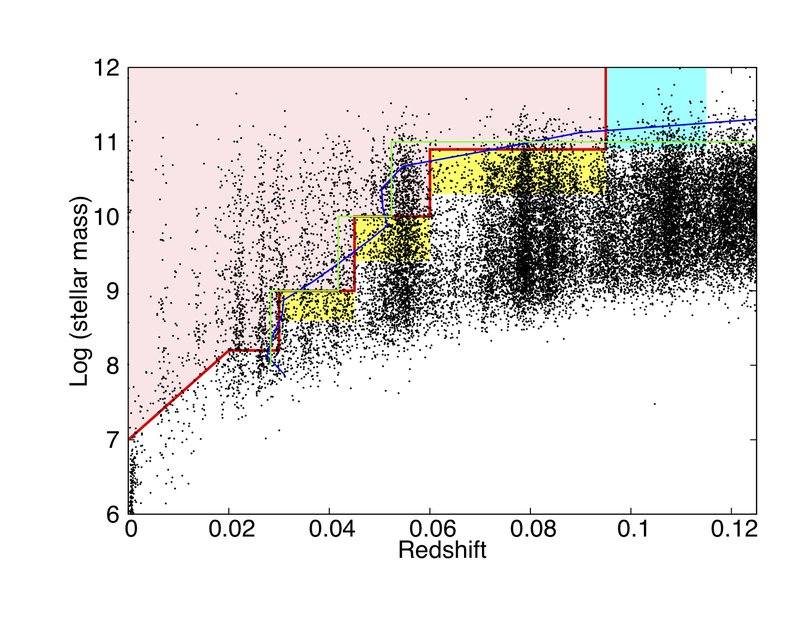
Caption: The distribution of SAMI-GAMA galaxies in the redshift vs. stellar mass plane. The SAMI primary targets lie above the red line, and secondary targets are extended to lower stellar mass, between the yellow and red lines. The additional high redshift set of secondary targets is above the cyan line. Light grey points show the full SAMI Galaxy Survey sample. Taken from Figure 4 of Bryant et al. (2015).
2. The SAMI cluster sample
The environment of the GAMA-selected galaxies ranges from field galaxies to groups, with very few having halo masses typical of clusters of galaxies. To extend the survey to higher mass environments therefore requires the addition of galaxy clusters selected to have virial masses $>10^{14} \rm M_{sun}$. Clusters were chosen with an R.A. range of 22-03hrs so that they are observable in the second half of the year, as the GAMA fields are all observable in the first half of the year. The 8 clusters in the SAMI cluster sample are listed below. They were picked to overlap with either the SDSS or 2dFGRS to make use of the existing redshift catalogues for selection of cluster members. We measured additional redshifts (Owers et al. 2017) using AAOmega fed by the 2dF multi-object fibre-feed for cluster candidates that have $r<19.4$ mag to reach 90% completeness in the cluster fields.
| Cluster name | RA (deg) | Dec (deg) | z | Virial mass $(10^{14}\rm M_{sun})$ |
|---|---|---|---|---|
| EDCC 0442 | 6.381 | -33.047 | 0.0498 | $3.6\pm0.7$ |
| Abell 85 | 10.460 | -9.303 | 0.0549 | $17.0\pm1.3$ |
| Abell 119 | 14.067 | −1.255 | 0.0442 | $9.7\pm1.1$ |
| Abell 168 | 18.740 | 0.431 | 0.0449 | $3.0\pm0.4$ |
| Abell 2399 | 329.389 | −7.794 | 0.0580 | $6.1\pm0.8$ |
| Abell 3880 | 336.977 | −30.575 | 0.0578 | $4.6\pm1.1$ |
| APMCC 0917 | 355.398 | −29.236 | 0.0509 | $2.1\pm0.6$ |
| Abell 4038 | 356.895 | −28.125 | 0.0293 | $2.9\pm0.5$ |
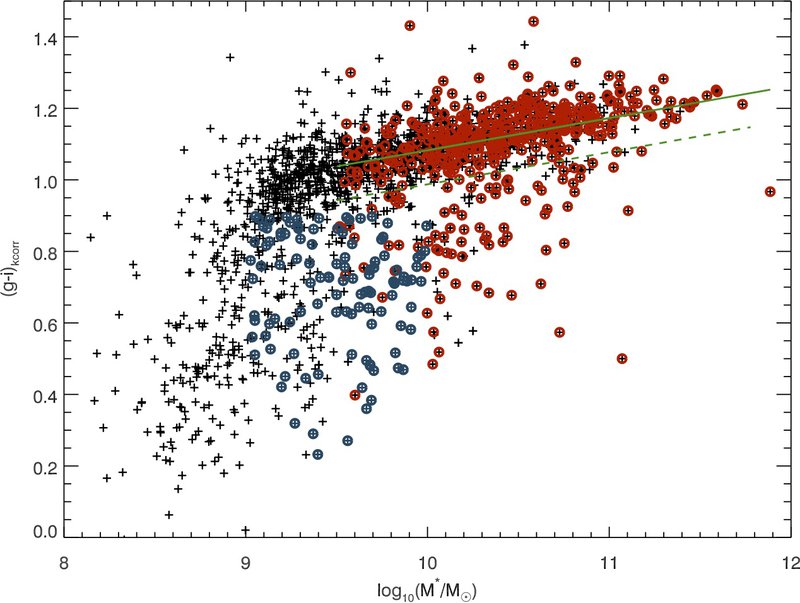
Caption: The k-corrected (g − i) colours versus stellar mass for the different SAMI-cluster target priorities. The primary targets are shown as red circles and blue fillers as blue circles. Large-radius-fillers are omitted for clarity. The black crosses show the distribution of all spectroscopically confirmed members. The green line shows the best fitting linear relation to the red-sequence for the high-priority SAMI cluster targets. The dashed green line shows the dividing line used to separate red-sequence and blue-cloud galaxies. Taken from Figure 14 of Owers et al. (2017).