OzDES DR2
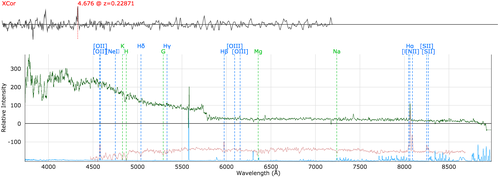
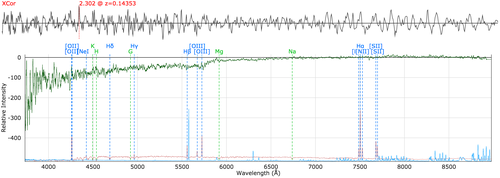
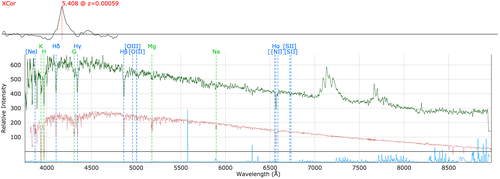
The second OzDES data release consists of a redshift catalogue and spectra of all objects in the catalogue. A detailed description of DR2 can be found in the OzDES DR2 paper. This page summarises the main characteristics of the data release, and contains examples of artefacts that contaminate some spectra.
Catalog
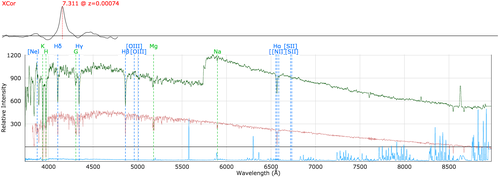
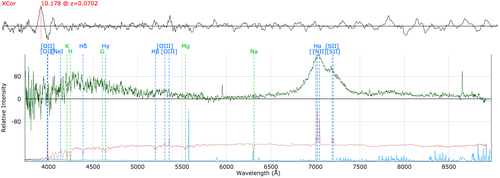
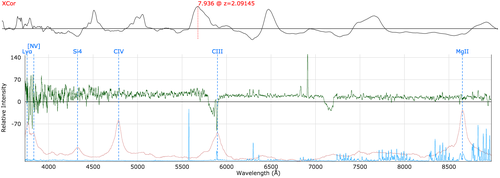
The OzDES-DR2 redshift catalogue is a FITS binary table containing almost 38,700 entries, of which almost 30,000 have a redshift with quality flag 3 or greater.
The redshift quality flag has the following meanings
- Q = 4: redshift based on multiple strong spectroscopic features matched, > 99% confidence.
- Q = 3: redshift based typically on a single strong spectroscopic feature or multiple weak features, >95% confidence.
- Q = 2: potential redshift associated with typically a single weak feature, low confidence, not to be used for science.
- Q = 1: no matching features, thus no constraints on redshift.
- Q = 6: securely classified star.
Each object may have one or more object types associated to it. For example an object may have been selected because it hosted a transient or because it a Luminious Red Galaxy (LRG).
Some transients were classified spectroscopically. For these cases, the type is listed.
Directory Structure
The data are sorted in three directories
- 2dF+AAOmega_x5700
- 2dF+AAOmega_x6700
- 2dF+AAOmega_x5700+x6700
During January 2019, an opportunity arose to take additional data in the X3 and C3 DES deep fields with the x6700 dichroic. The wavelength region covered by the x6700 dichroic is about 1000 Angstroms redder that the region covered by the x5700 dichroic, so the data are split into three directories, depending on whether or not sources were observed with the x6700 dichroic or not.
2dF+AAOmega_x5700: only contains data using the x5700 dichroic. These were taken before January 2019.
2dF+AAOmega_x6700: contains data that were only observed with the x6700 dichroic. These were obtained during January 2019.
2dF+AAOmega_x5700+x6700: combines data taken with both dichroics. It alsocontains the individual spectra obtained in January 2019.
Format of the spectral data
OzDES data are stored as FITS files. With the exception for targets that were observed with the x5700 and x6700 dichroics, there one file per object. Each file contains multiple extensions.
Primary HDU: Stacked spectrum
1st extension: Variance spectrum for the stacked spectrum
2nd extension: Bad region mask (0=good, 1 = bad) for the stacked spectrum
3rd extension: Spectrum of first epoch
4th extension: Variance spectrum of first epoch
5th extension: Bad region mask for first epoch
...
3ith extension: Spectrum of ith epoch
3i+1th extension: Variance spectrum of ith epoch
3i+2th extension: Bad region mask for ith epoch
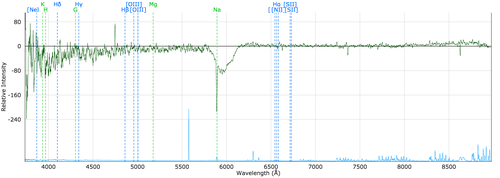
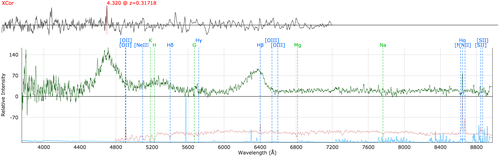
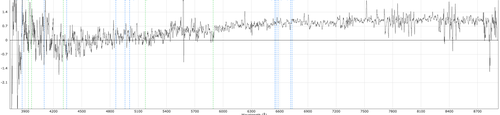
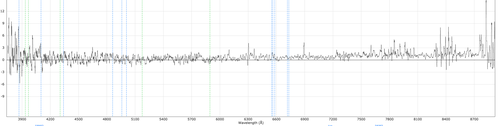
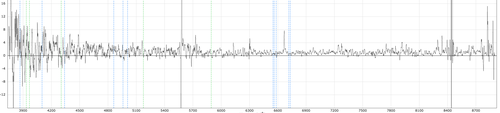
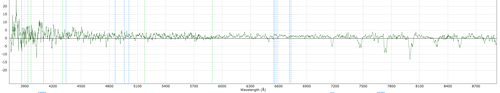
Artefacts in the spectra
The spectra are not completely free of artefacts. The main artefacts are listed below. We list the name used in the quality control keyword that is recorded in the FITS header as QC, together with a short description and an example.
700nmLED: Contamination from the IR LED in the gripper arm.
This was discovered a few years into the survey, so it mostly affects early data.
redDip: Most likely associated to charge traps in the old AAOmega red CCD. Affects data taken prior to run007.
doubleDip 1 and doubleDip 2: Most likely associated to charge traps in the old AAOmega red CCD. Affects data taken prior to run007.
doubleHump: Origin unknown.
fib388p0: Issues with fibre 388 on plate 0. Results in significant residuals near bright night sky lines. Cause unknown.
fib94p1: Issues with fibre 94 on plate 1. Results in significant residuals near bright night sky lines. Cause unknown.
redfail or redPCAFail: Poor sky sutraction of the bright night sky lines in the red arm. There appear multiple causes, including unmasked cosmic rays causing the PCA sky subtraction algorithm to fail.
bluefail: Failed reduction in blue arm.
failedReduction: Failed reduction, both arms.
brightStarBlue: A bright star in a nearby fibre causes the reduction in the blue arm to fail or contaminates the extracted spectrum of a nearby fibre, causing either an excess or a deficit in the flux.
brightStarRed: As above, but for the red arm.
brightStarAll: As above, but for the entire spectrum. Usually caused by an extremely bright star in the a nearby fibre.
fringed: Fringes detected.
poorConditions: Poor observing conditions, e.g. cloud and/or bad seeing.
blueSkySubFail: Sky subtraction failed in blue arm.
blueFeature 1: A blue feature of unknown origin.
IRcontamination: Contamination in the red arm of unknown origin.
Other Artefacts not recorded as in the QC parameter
Charge traps in the red CCD: Seen as dips in the red end. Usually affects fibres that are between fibres 370 and 390.
Discontinuities in the continuum near the Dichroic split: Caused by a failure to determine the scale factor between the two arms. correctly.