
Cutout Service
Syntax
Position
Source List source_list
Enter a source name or list of names (separated by a comma). Source names must be prepended by the survey_datarelease prefix. Sources are addressed in the form:
SURVEY_DATARELEASE_SOURCENAME
with an underscore (_) as the delimiter.
For example, GAMA source 202627 as catalogued in the second data release is addressed as:
gama_dr2_202627
not any of the following
G202627 g202627 202627
The cutout uses the following catalogues to look up identifiers for a particular survey_datarelease.
Survey + Data Release Prefix Table GAMA DR2 gama_dr2 gama_dr2.InputCatA SAMI DR1 sami_dr1 sami_dr1.InputCat GALAH DR1 galah_dr1 galah_dr1.InputCatalog
An example source list might look like:
gama_dr2_202627, sami_dr1_278855
Note: if you submit an ID without the data release prefix (e.g., gama_65406), the cutout will use the most-recent input catalogue as provided by the team (ie., the most recent data release) to try and find the source position.
RA/Dec ra, dec
The cutout supports wide variety of input formats for coordinates:
- degrees (10.2345d)
- sexagesimal degrees (1:2:30.43d)
- sexagesimal hours (1 2 0 hours)
- degree, arcmin, and arcsec (1d2m3.4s)
- hour, minute, second (-1h2m3s)
Don't forget to include the string format identifier, e.g., for coordinates in degrees, append 'd'. See astropy's angle documentation for a list of all possible formats.
Upload file upload_file
Upload a file containing one [survey_datarelease_sourcename] or two [RA, Dec] columns (comma separated), as per the format in the RA/Dec fields. You cannot mix source names and positions, upload either a one-column or two-column file.
Accepted file formats: .ascii, .txt, .text (MIME type text/plain). Max file length: 2000 rows. Lines beginning with '#' are ignored. Duplicate entries are ignored.
An example file containing source names might look like:
# source ids (including survey_dr prefix) gama_dr2_202627 gama_dr2_202628 gama_dr2_673010 gama_dr2_202647 sami_dr1_278855 gama_dr2_797782 gama_dr2_202691 gama_dr2_2026000
Similarly, a file containing Ra, Dec:
# RA, Dec 12:28:8.96234693960d, -11:14:15.35367885116d
Radius radius (arcseconds)
The radius to cutout. Note that the service will cut out a square region, so radius here is equivalent to half the box width. Maximum value 600".
Greyscale Images
Greyscale greyscale
Select the greyscale checkbox to generate single-band cutouts.
Bands bands
Choose bands from the multiple selection box. To select multiple bands, hold down cmd ⌘ or ctrl and click. The available bands are listed below, though coverage may not be complete across all GAMA regions.
Available Bands
GAMA PDR Facility Bands Chandra
0520 0570 2070
GALEX
FUV NUV
HST
F606W F814W F125W F160W F435W F475W F475X F775W F850LP F098M F225W F275W F336W
SDSS
u g r i z
VSTKIDS
u g r i
Subaru
B V g r i z
CFHT
u g r i z H K
VIKING
Z Y J H K
UltraVISTA
Y J H K
WISE
1 2 3 4
Spitzer
I1 I2 I3 I4 M24 M24d M70 M160
Herschel
P70 P100 P160 S250 S350 S500
Region Coverage (for reference only)
GAMA PDR Region Available Bands G09, G12, G15
GALEX (FUV,NUV)
SDSS (ugriz)
VIKING (ZYJHK)
WISE (w1,w2,w3,w4)
PACS (70,160)
SPIRE (250,350,500)
G23
GALEX (FUV,NUV)
VIKING (ZYJHK)
PACS (70,160)
SPIRE (250,350,500)
Three colour images
RGB rgb
Select the rgb checkbox to generate a three-band RGB composite image from single-band cutout images. The scaling is taken from the input_scaling field (default = log)
Red rgb_red
Band to use for the red channel.
Green rgb_green
Band to use for the green channel.
Blue rgb_blue
Band to use for the blue channel.
Image Scaling
For visualization purposes only, the cutout data values are re-mapped. Firstly, values are are normalized to the range (0, 1) and bad values are rejected. The resultant array can be mapped using the input_scaling field. If input_scaling is 'atan' or 'asinh', the user can also supply a stretch_scale, which controls what parts of the data is in the linear or logarithmic regime of the stretch procedure. If set to 'auto' it uses 1/median(abs(data)) to find a useful scale. Lastly, if provided, data are clipped between the locut and hicut values default. This can help enhance features in the data that are otherwise difficult to see.
Input Scaling input_scaling
Linear, logarithmic, atan, asinh and sqrt scalings are supported.
Stretch Scale stretch_scale
A number to multiply the data by before applying the scaling (affects only asinh and atanh scaling).
Locut locut
Lower clipping quantile (default 0.4)
Hicut hicut
Upper clipping quantile (default 0.995)
Plot Options
Axis Style axis_style
Choose 'basic' = x/y axes drawn or 'none' = no axes drawn.
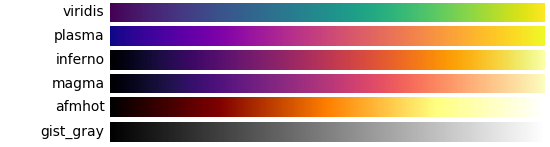
Colour Map cmap
Choose a colourmap to represent the cutout data values.
Invert Colour invert_color
If possible, invert the selected colour map.
Contour Band contour_band
Overlay the contoured data of a specified band.
Contour Levels contour_levels
Specify the contour levels to overlay (separated by a comma). Contour levels are calculated in terms of standard deviations above the median of pixels in a clipped cutout. The current cutout pixels are clipped at 1.5*standard deviations above and below the median, and contour levels are assigned at X times standard deviations above the median of the remaining pixels. Required if contour_band is given.
Plot Title plot_title
Include an automatically-generated plot title displaying source name and band(s).
Central cutout position plot_center_position
Overplot the central cutout position (symbol: +).
Coordinate grid plot_grid
Overplot the coordinate grid.
Source positions plot_source_positions
Overplot source positions from selected survey_datareleases.
Survey Data Release Marker GAMA DR2 ▵ SAMI DR1 ▢ GALAH DR1 ☆
Survey source identifiers plot_source_ids
If plot_source_positions has a value, also plot the source ids.
Plot Legend plot_legend
If checked, and plot source positions has a value, overplot the legend identifying the source position in the upper-right corner of the plot window.
Additional Options
Fits fits
If checked, generate .fits files from the cutout regions for download.
Add to the queue run_async
Checking the Add to the queue checkbox above will submit your request to the queue. Typically, quick-look requests (several sources and bands) should be run instantly, but for complicated requests we recommend sending it to the queue!
Submit (unchecked) The request will run immediately, but if it contains many components (sources, contours, lots of bands selected), it could take some time, and you will not be able to close this window whilst it processes.
Queue (checked) Add this request to the queue. Data Central will process your request in the background, and you will receive an email when it completes.
Cutout history
If you are logged in to Data Central, your cutout history will be saved. You can revisit your history at any time by clicking on the Cutout History tab.
Coming soon
Overplot AAT fiber positions, GAMA apertures, multiple RGBs, colour picker for contour band.