Data reduction and analysis
Data Reduction
Methodology
See Kos et al. (2017) for all the details of the data reduction.
Raw images are corrected for bias level and flat field, and cosmic rays are removed with a modified LaCosmic algorithm (van Dokkum 2001). Scattered light and fibre-cross talk signals are removed. The wavelength solution for the extracted spectra is found via fitting of ThXe arc lamp observations. Sky spectra are modelled from the 25 sky fibres included in each field and subtracted, and synthetic telluric lines are computed using molecfit (Kausch et al. 2015; Smette et al. 2015) and removed from observed spectra. The reduction pipeline runs a cross-correlation with AMBRE spectra (De Laverny et al. 2012) to provide a first estimate of stellar parameters Teff, log g, [Fe/H], and radial velocity, (these values are labelled as x_guess in the main_spec catalogue; see the Table Schema page) and to normalise the spectra.
Changes in data reduction from GALAH Data Release 2
There have been two major improvements to the data reduction:
- The main improvement is the wavelength solution, which is now more stable at the edges of green and red CCDs, where we lack arc lines. This has been achieved by monitoring the solution and fixing the polynomial describing the pixel-to-wavelength transformation, if deviations from a typical or average solution are detected.
- Cross-talk is now parametrized differently. It can only be measured in larger gaps between every 10th spectrum.
Data Analysis
Methodology
See Buder et al (2021) for all the details of the data analysis.
We first estimate stellar parameters and then keep them fixed while only fitting one abundance at a time for the different lines/elements in the GALAH wavelength range. For the stellar parameter estimation, we perform a first normalisation and a first rough stellar parameter fit with one iteration, followed by a final normalisation and finer parameter fit with more iterations. For the abundance analysis, we only perform one normalisation and iteratively optimise the abundance based on those data points of the lines/elements that we estimate to be unblended enough after comparing a synthesis with all lines and another one with only the lines of the element in question.
Below we describe this workflow in more detail, which mirror the challenges on technical and physical aspects of the analysis of very different spectra:
- Initialise Spectroscopy Made Easy (SME; version 536) with choices of line data, atmosphere grid, non-LTE departure grids, observed spectrum (limited to the 46 segments used for the parameter estimation) including selection of continuum and line masks, initial parameters for χ2 optimisation.
- Normalise all 46 segments individually with the chosen initial setup by fitting linear functions first to the observed spectrum and then to the difference of the observed and synthetic spectrum.
- Optimise the stellar parameters Teff , [Fe/H], vbroad (v sin i with vmac set to 05), and global radial velocity with 2 major SME update loops (calculating double-sided partial derivatives and exploring the local χ² surface with up to 5 different parameter choices). Consistently update log g and vmic from physical and empirical relations, respectively, with every change of Teff or [Fe/H]. In our test, this already led to updated parameters close to the χ² global minima.
- Normalise all 46 segments again individually as in step 2, but with updated stellar parameters.
- Optimise the stellar parameters Teff, [Fe/H], vbroad, and vrad with up to 20 major SME update loops as in step 3 until fractional change of χ2 is below 0.001
- Collect stellar parameters for validation. Save covariance uncertainties, based on the statistical χ² uncertainties given the uncertainties of the normalized flux, in addition to the uncertainties delivered by SME version 536.
- Initialise SME (version 536) for the element abundance estimation with choices of line data, atmosphere grid, non-LTE departure grids, observed spectrum (limited to line segement(s) used for the element abundance estimation) including selection of continuum and line masks, final global atmosphere parameters for χ² optimisation.
- Normalise all segments for the line (e.g. Li6708) or element (e.g. Ca) run individually with the chosen initial setup by fitting linear functions first to the observed spectrum. Improve this normalisation by fitting a linear function to the difference between the observed and synthetic spectrum to create a ’full’ synthetic spectrum.
- Because the same line exhibits different degrees of blending in different stars, which are complex and difficult to predict ab initio, perform a blending test by creating a 'clean' synthetic spectrum only based on the lines of the element to be fitted. Then compare the 'full' and 'clean' spectra for the chosen line mask pixels and neglect those which deviate more than ∆χ2 > 0.005 for elements other than Fe.
- Optimise the relevant element abundance entry in the abundance table (sme.abund) with up to 20 major SME update loops until fractional change of χ² is below 0.001. The atmosphere is updated with each change of chemical composition to stay consistent, but we note that for the sake of computation cost with SME, the abundances, that are not fitted, are kept at scaled-solar, with the exception of Li with A(Li) = 2.3, an enhancement of 0.4 fex for N, and the precomputed α-enhancement for α-process elements.
- Collect stellar parameters and element abundances for validation and post-processing.
- Calculate upper limits for each element/line for non-detections by estimating lowest abundance would lead to a line flux depression of 0.03 below normalised continuum.
- Post-processing: apply flagging algorithms, calculate final uncertainties from accuracy and precision estimates, combine line-by-line measurements of element abundances weighted by their uncertainties.
Change in data analysis from Data Release 2
There are two main changes to the analysis methods for DR3 compared to DR2.
- We are using astrometric information from the Gaia DR2 mission to break spectroscopic degeneracies.
- GALAH DR3 uses Spectroscopy Made Easy (SME) for all the stellar parameter and elemental abundance determination. For the second data release of the GALAH survey we made use of data-driven approaches to improve both speed and precision of the spectroscopic analysis. Although the data-driven approaches were successful for the majority of GALAH DR2 stars, we know that these approaches can suffer from signal aliasing, they can learn unphysical correlations between the input data and the output stellar labels, and the results are not necessarily valid outside the parameter space of the training set. We found in DR2 that the data-driven approaches meant that stars at the periphery in stellar label space, e.g. high temperature or low metallicity did not receive optimal labels from the data driven process.
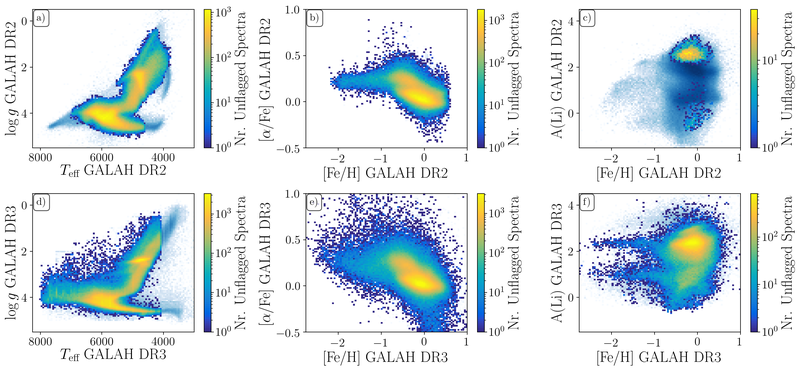
Below is a comparison of GALAH DR2 (upper panels) and GALAH DR3 (lower panels, this release). The smooth light blue background indicates all measurements, whereas the colormap shows the number of unflagged measurements at each point. The stellar parameters and abundances from GALAH DR2 appear more tightly constrained, but we note that this is an artefact of the data-driven approach, which tends to find solutions closer to the mean parameter/abundance patterns.
Missing stars from GALAH DR2
There are 7249 stars that have data in GALAH DR2 but are not found in GALAH DR3. This is primarily because they lack the necessary Gaia DR2 information. One of the important priors for GALAH DR3 is the parallax information from Gaia DR2 for an initial estimate of the surface gravity of the stars. This was not the case of GALAH DR2. As such, 2407 of the 7249 stars (33%) have no Gaia DR2 match; a further 3772 (52%) have only a two-parameter solution in Gaia DR2 and as such lack a parallax value. The remaining 1041 stars (14%) were found to have major reduction issues that prevented their spectra from being analysed.