Fruitflies reporting tool
The fruitflies reporting tool has been developed to allow researchers working on fruitflies at MQ to manage and upload their initial data and have it transformed into a format that is more accessible to the researchers. The tool currently allows for researchers to:
- Upload a CSV dataset in a specified format, and associate metadata with it.
- Download a new CSV generated from a dataset in a number of specific formats.
- Generate line plots of a specific dataset (including data from generated columns).
- Modify the required fields in the upload form.
Uploading a file
To upload a file, head to https://reports.datacentral.org.au/fruitflies/, and click the "Upload data" link on the left hand side (this goes to https://reports.datacentral.org.au/fruitflies/upload/).
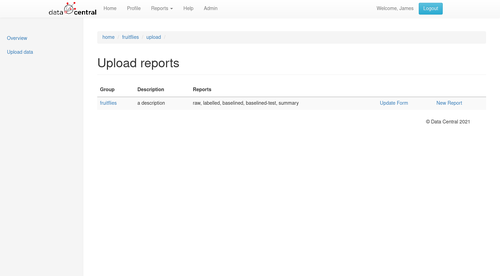
On this page, you can see a list of projects you can upload to.
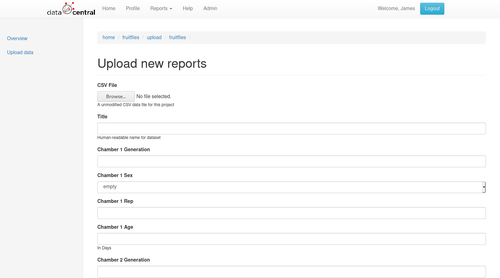
Clicking the name of the project (e.g. "Fruitflies" sends you to a page where you can upload the file, and add metadata.
Downloading files
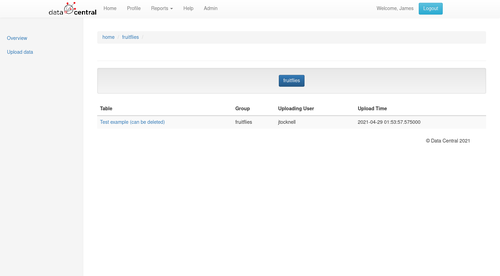
On the overview page, you can see a list of datasets for the projects you are in.

The datasets can be filtered by project by clicking the blue buttons.
Clicking the name of the dataset sends you to a page where you can view different reports for the dataset. "Raw" is the uploaded CSV format, and the other formats are those requested (or test ones to check intermediate steps in the reporting).
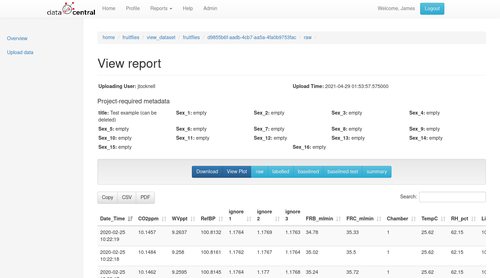
The dark blue buttons perform actions (e.g. download, plot) on the current dataset, whereas the light blue buttons choose the report format. Hitting the download button naturally downloads the dataset, in the format of a CSV. Note that the metadata is not in the CSV currently.
Plotting
By following the instructions in the download section above, you should be able to head to the page to view a specific dataset.

On that page (shown above), hitting the "View Plot" button sends you to a new page where you can plot the columns on a line graph. Some columns are selected by default, but you can change the columns used for the X and Y axes, and the option to factor over a column by colour.
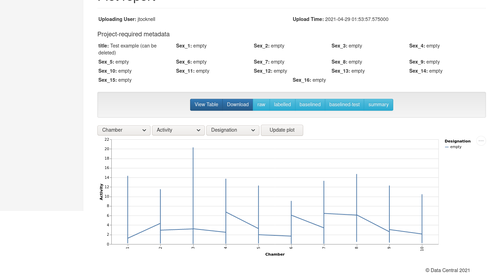
Like the view page, you can choose which report to use when plotting by clicking the light-blue buttons.
The plot is draggable, and a SVG or PNG image of the current view can be downloaded by clicking the three dots within a circle to the top-right of the plot (the plotting system uses Vega, which stores its data as JSON—this can be plugged into other systems to generate more complex plots).
Modifying the form
It is possible to modify the form format that is used when uploading a dataset (e.g. to add or remove fields). To do this, click the "Upload data" link to the right, then the "Update form" link for the project whose form you wish to modify. This will take you to a page like the one below:
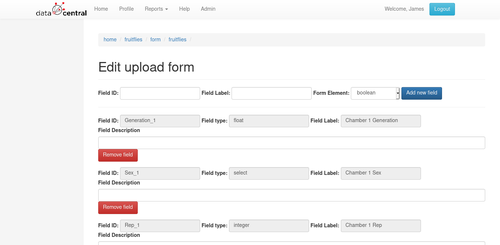
The top section allows you to add new form elements, whereas the bottom allows you to modify or remove them.
The field ID must have no spaces, and the form element select box tells the form what HTML form element to use (https://developer.mozilla.org/en-US/docs/Learn/Forms covers the basics of HTML forms).
Current limitations
The system does have limitations, it would be good to get feedback on whether these limitations are problematic or not (or whether they are "nice to have" features):
- Currently the download formats require modification of the reporting codebase—this is because the baselining requires a fair amount of custom code.
- Currently it is not possible to modify a dataset after it has been uploaded—this is somewhat by design (i.e. a new dataset should created if the data needs to be changed), but it is possible to provide an interface to modify them if needed.
- Currently there is no user interface to configure the upload format settings.
